

...
The true power of InfraNodus text analysis tools is its ability to provide detailed insight about the relations present within a discourse.
You can select any relation in a text to see what other terms are connected to it.
Step 1: Select 1, 2, or 3 Different Nodes on the Graph
To be more objective, you can select the most influential word (biggest on the graph) and another influential word it connects to. For instance, in a scientific article that talks about race and minorities the two most influential and frequently appearing terms are "racial" and "minority".
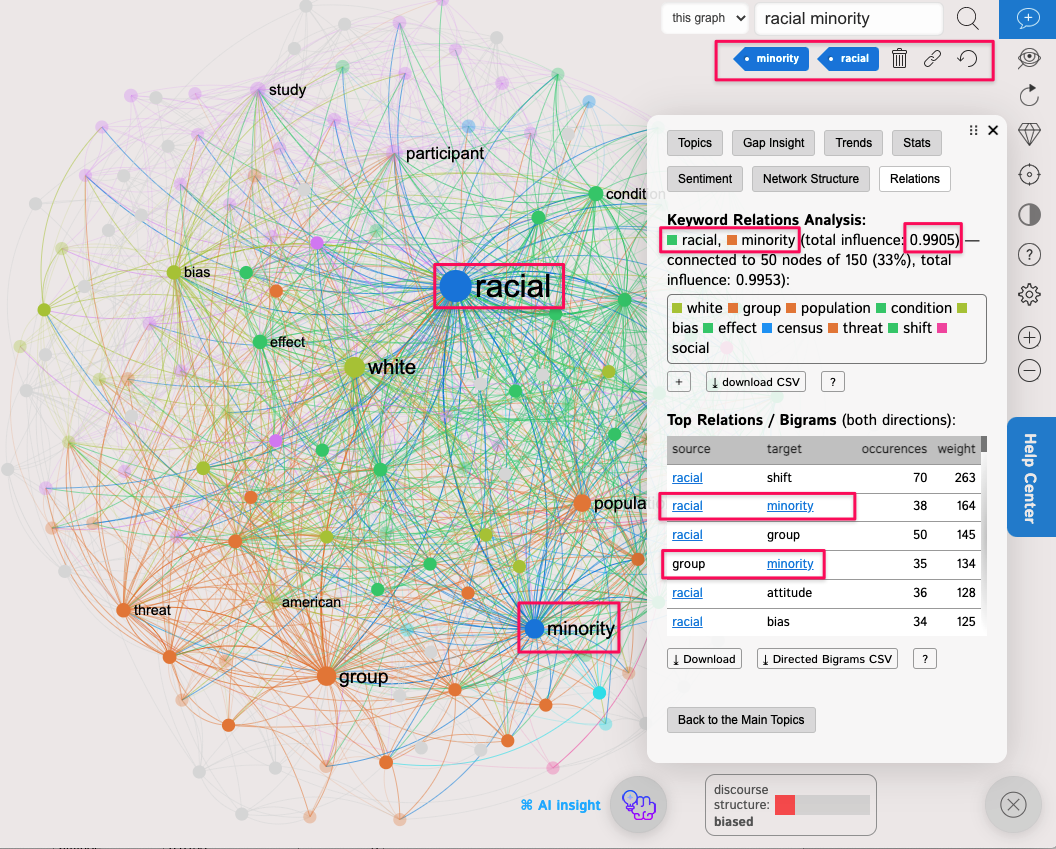
You can see the information about the relation between them if you click on Analytics > Relations:
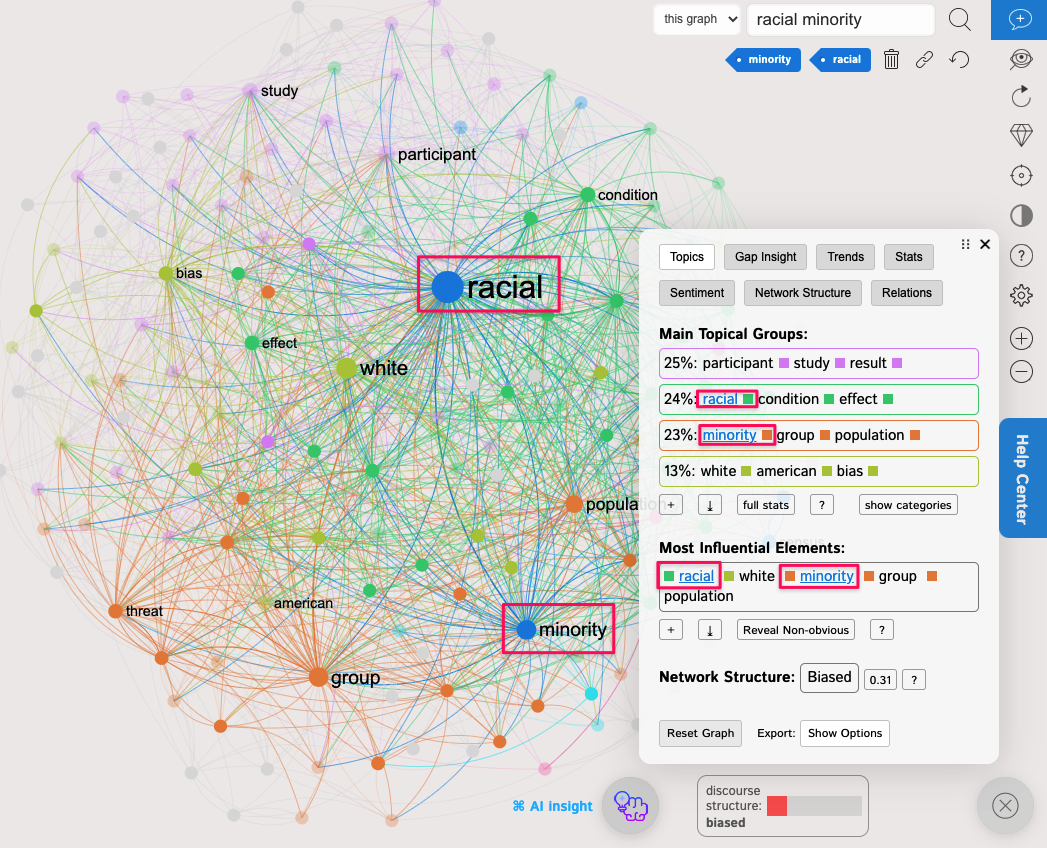
We can also confirm these terms are important in the Analytics > Topics panel, because they appear both in the Top Topics (as the most relevant words in each cluster), and also in the Top Influential Nodes panel:
Step 2: Relation Importance in Quantitive Terms
The Analytics > Relations panel shows us that both "racial" and "minority" have a total relative influence of 0.995 — 1 is the maximum for each node).
Influence, in this case, is measured using Betweenness Centrality measure. But you can also use the more traditional measures such as Frequency (available in Analytics > Stats panel), which usually correlates with betweenness centrality.
We can also see the two terms, "racial" and "minority" are connected to 50 other nodes (33% of the graph) with a total influence of 0.9953. That means that those two words are quite influential in this discourse.
Step 3: What other Terms this Relation is Connected To?
Below we can also see what are the words the terms we selected ("racial" and "minority") are connected to in this text
These are: "white", "group", "population", "condition", "bias", and others.
We can click one of these words, for instance, "bias" and see what are the terms that "racial", "minority", and "bias" — altogether — are connected to:
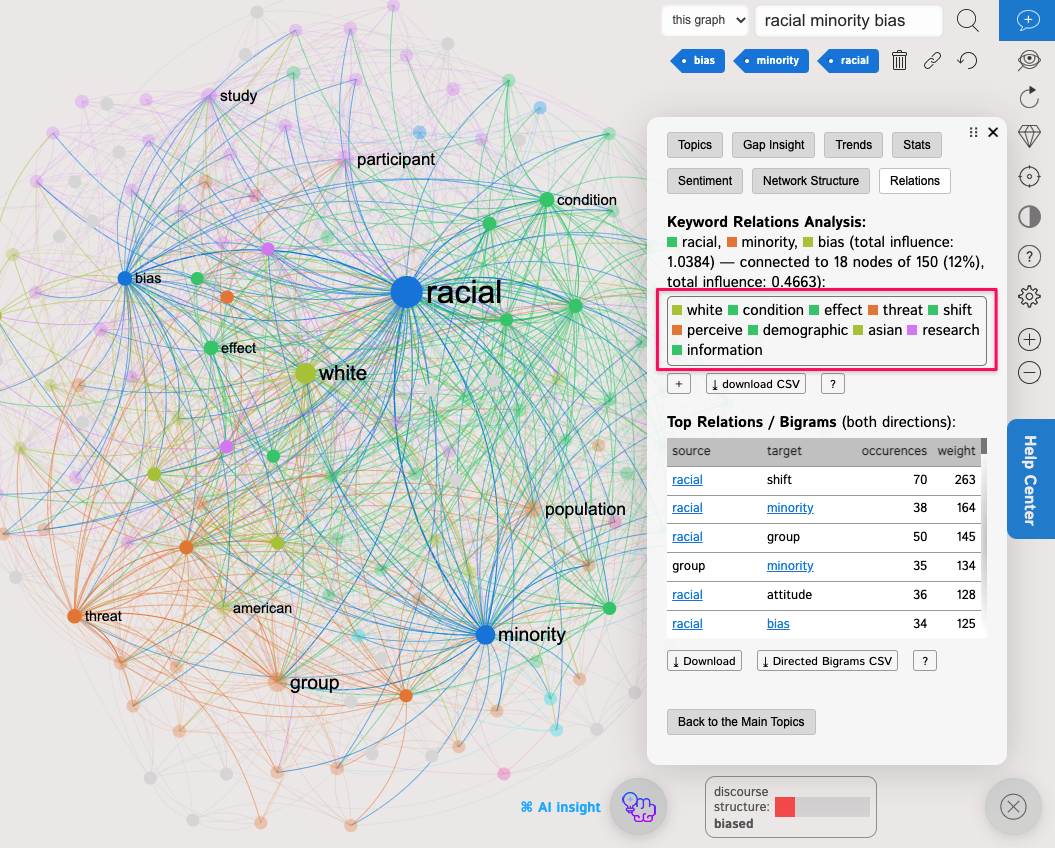
We can see, that those are "white", "condition", "effect" and "threat". We can already decipher the meaning from those relations and understand that the authors are talking about "perceived threats and racial minorities".
To confirm, our hypothesis, we can also select the term "threat", then open the actual statements and see the parts of the text where these 4 selected terms ("racial", "minority", "bias", and "threat") are used:
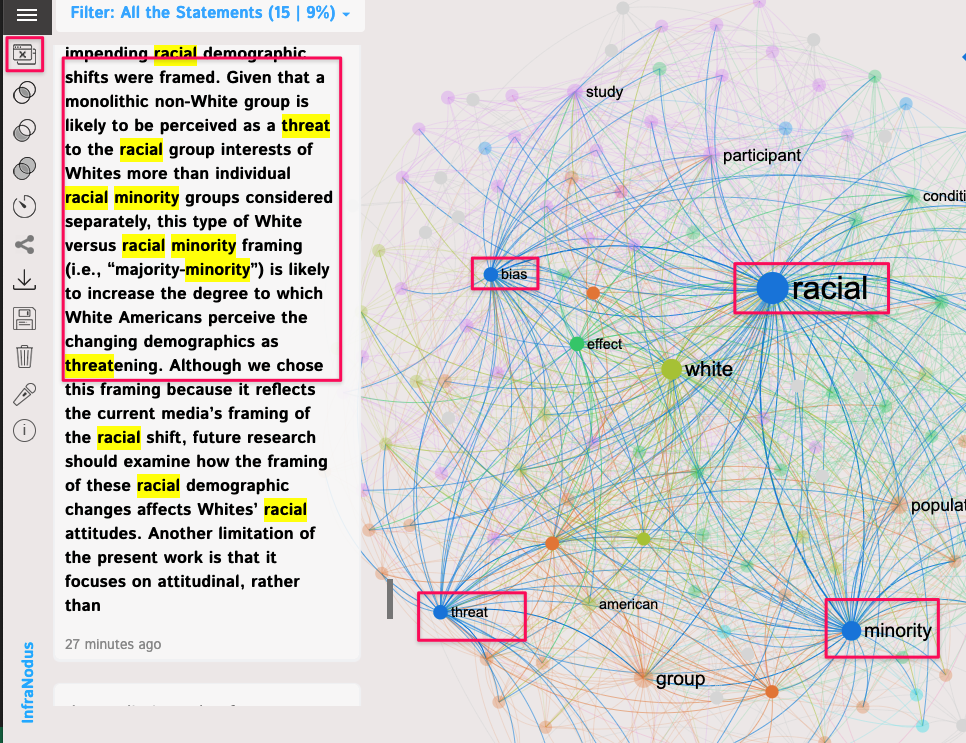
As we can see, the authors, are, indeed, talking about the perceived threat among white Americans to a changing demographics.
Milestone #1: Using a few clicks, we quickly understood some of the top semantic relations and issues present in the original research paper.
You can reiterate this process with the other top terms or selecting the terms that are interesting for your research as well.
Step 4: How to Compare the Importance of Semantic Relations and Bigrams Across Different Texts?
Another interesting thing you can do is to compare how the different terms appear in different texts.
For instance, in the first example, we used a scientific article on racial minorities and revealed an important relation: "racial", "minority", "bias", and "threat".
Let's take a New York Times article that cites this research paper and see how important those semantic relations are in that other text. In order to do that, we import it into InfraNodus and type in the first two terms — "racial" and "minority" into the search box, then click on Analytics > Relations:
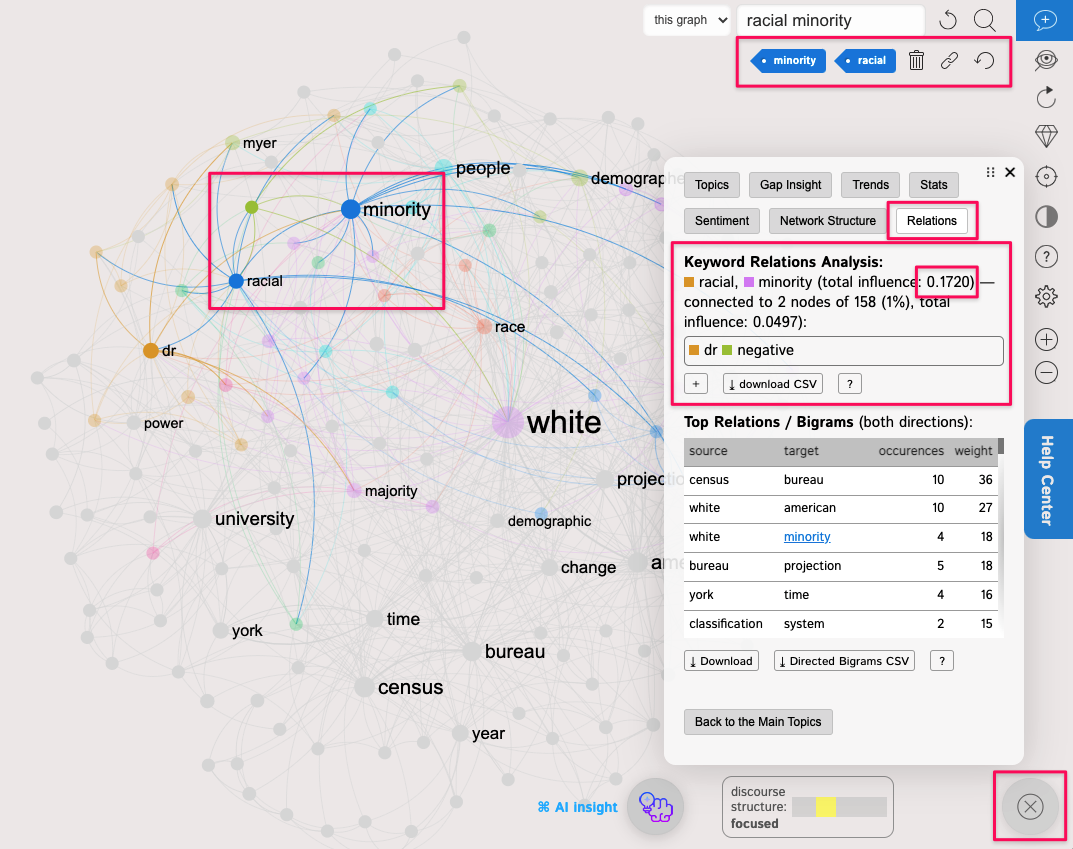
As we can see, the total influence of those terms in this NYT article is much lower than in the original research paper. Instead of connecting to the terms like "bias" and "perceived threat" it is connected to the word "negative" in this context.
So while they are citing the paper, the focus is different. It is more on the "census bureau" data than on "bias" and "heat".
To find out what's happening here, we choose the top influential terms in this article, just like we did in the Step 1 above, but for this new text:

We see that they're talking about "white" "Americans" and the context is related to the words like "census", "projection", "race", "Hispanic" etc. So something about what the census projections and the statistics for the minority races.
If we now come back to the original research paper, which was cited in this research article, and choose the same two terms here: "white" and "Americans", we will see a different picture:
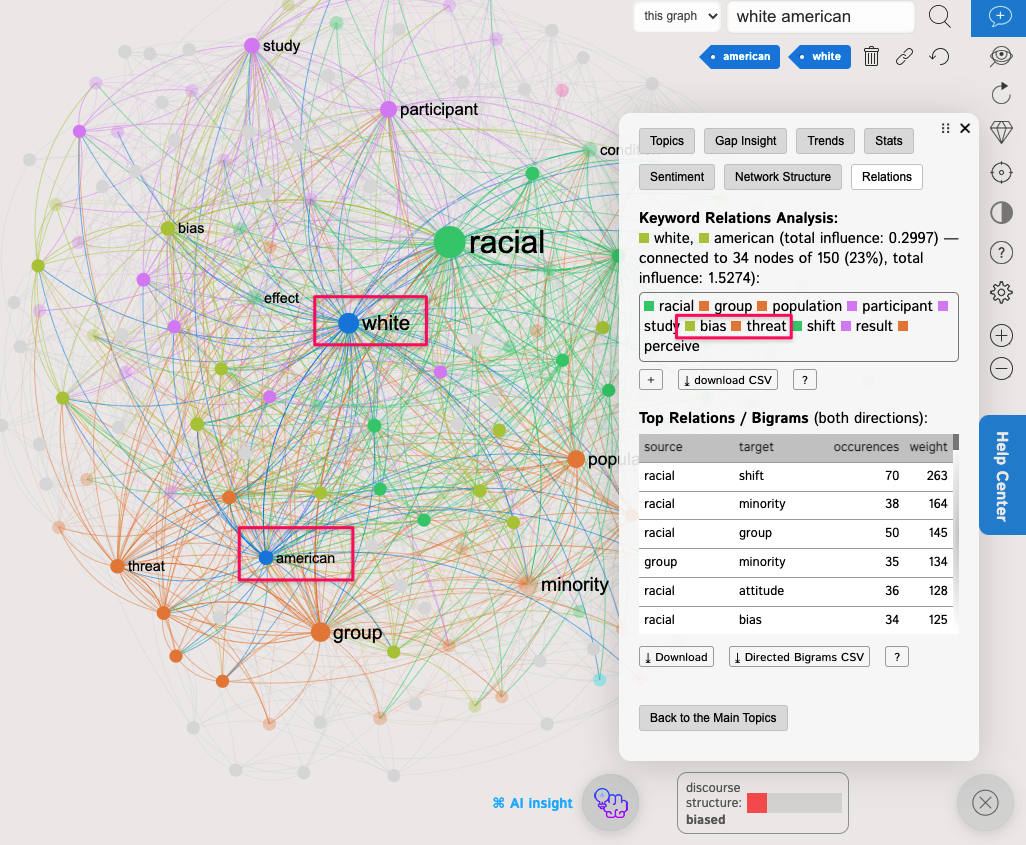
The context where those two terms are used in the original research paper also mention "bias" and "perceived threat" that this group ("white Americans") experiences towards the people of racial minorites. While the New York Times article talks more about "census data" in the same context. The article does mention a few times that when White Americans are confronted with the census data that shows the increasing proportion of minorities, they may get a "negative" attitude towards that. However, it omits the important terms such as "bias" and "perceived threat", which point to a much more systematic problems. The NYT article, it seems like, is concerned with the publication of data by the census bureau rather than the nature of the origin of the problem.
Milestone #2: We discovered how a NYT article is different from a research paper it cites on the same topic, omitting important terms and semantic connections in favor of shifting the problematic from a systematic cultural issue to a public policy one.
Step 5: Run Sentiment Analysis on the Relation You Chose
Once you selected certain nodes on the graph, you will also see the filtered statements where those selected terms appear. You can then click on the Analytics > Sentiment tab to perform sentiment analysis for those filtered statements. You would then be able to see whether those terms you selected are used in predominantly "positive", "negative" or "neutral" contexts.
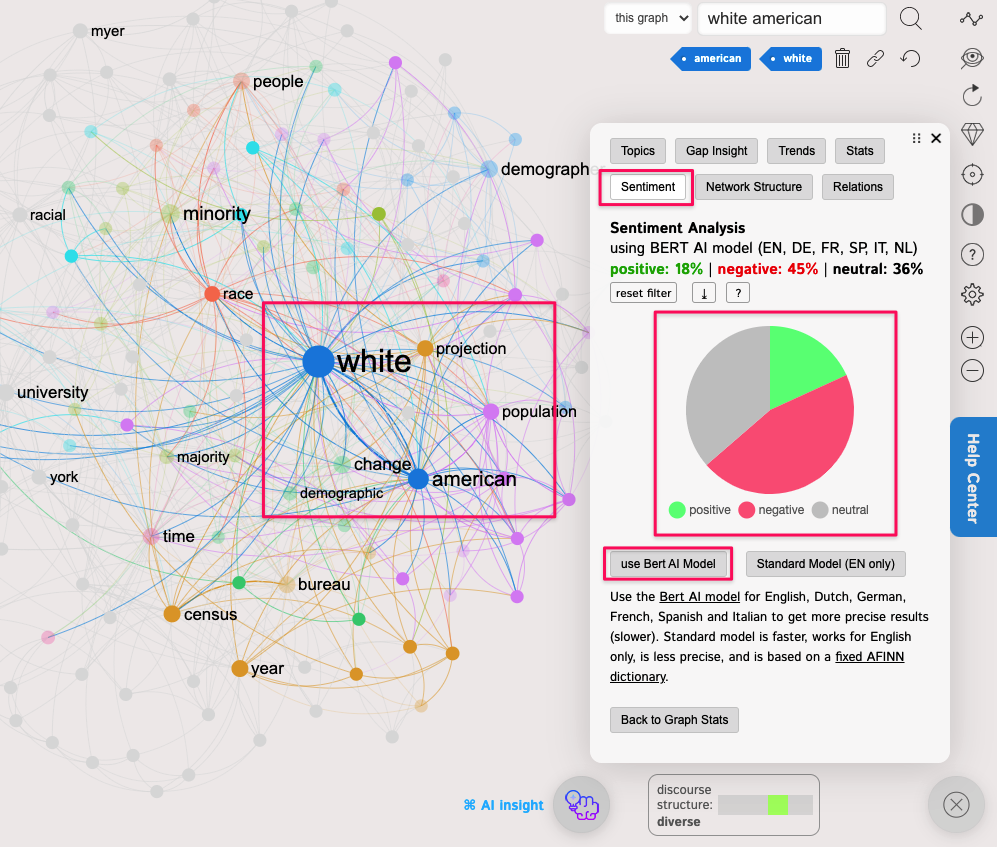
Comparing it to the scientific article, we can see that the NYT piece is more negative when it comes to "white Americans" than the scientific article is:
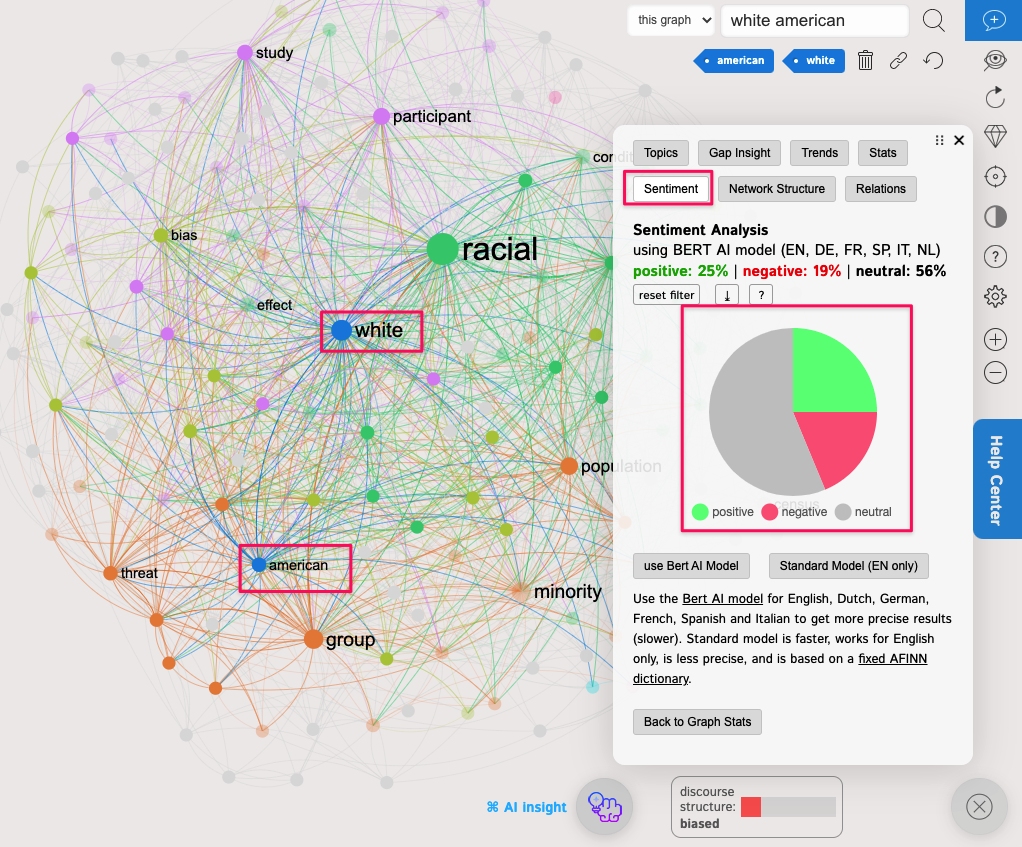
Milestone #3: We discovered that the original scientific publication is more neutral when it talks about "white Americans" than the NYT article (which is predominantly using this term in a negative context).
--
You can try this approach on your own texts on www.infranodus.com text network visualization and analysis tool.
Comments
0 comments
Please sign in to leave a comment.