

You can use InfraNodus to build mindmaps automatically using text input. The advantage of this approach to mind mapping is that you don't have to decide beforehand what the central idea is. You can just start writing and use plain text to build your maps, which is much quicker than using standard mindmap editors.
Watch the video tutorial below to learn how it works or follow the step-by-step process below:
We offer two ways to build your mind maps with InfraNodus:
1. Using #hashtags or [[wiki links]] to add the mind map elements
2. Automatic concept extraction from your text (text to mind map converter)

In both cases, our powerful graph analysis algorithms will detect the most influential elements and the topical clusters in your ideas. You will also be able to detect structural gaps in your thoughts and use our AI-powered tools to bridge those gaps and generate new ideas. Here is how it works.
Mind Mapping with Text, Step-by-Step Process
Step 1: Create a Graph
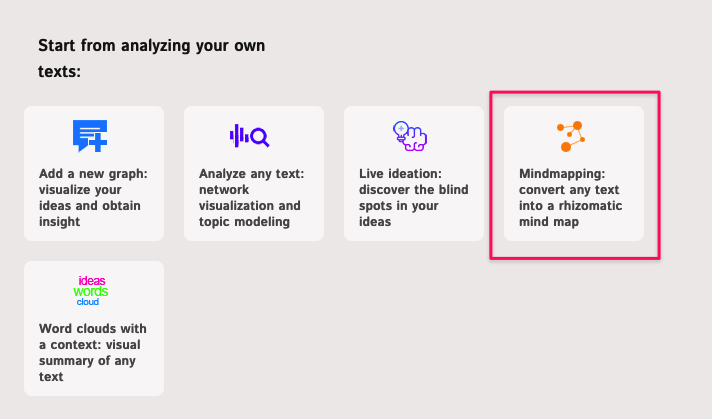
Open a new graph in InfraNodus. Choose the Mind Mapping app.
Step 2: Add the Data or Text
Once you see an empty graph, start typing your text, or copy and paste some ideas from an already existing one.
You have two ways to do that:
Approach #1: Using #hashtags, [[wiki links]], or @Mentions to add the elements to your mindmap
For example, you can write:
[[Steve Jobs]] worked at [[Apple Computers]] together with [[Steve Wozniak]]
click "Add" and you will get
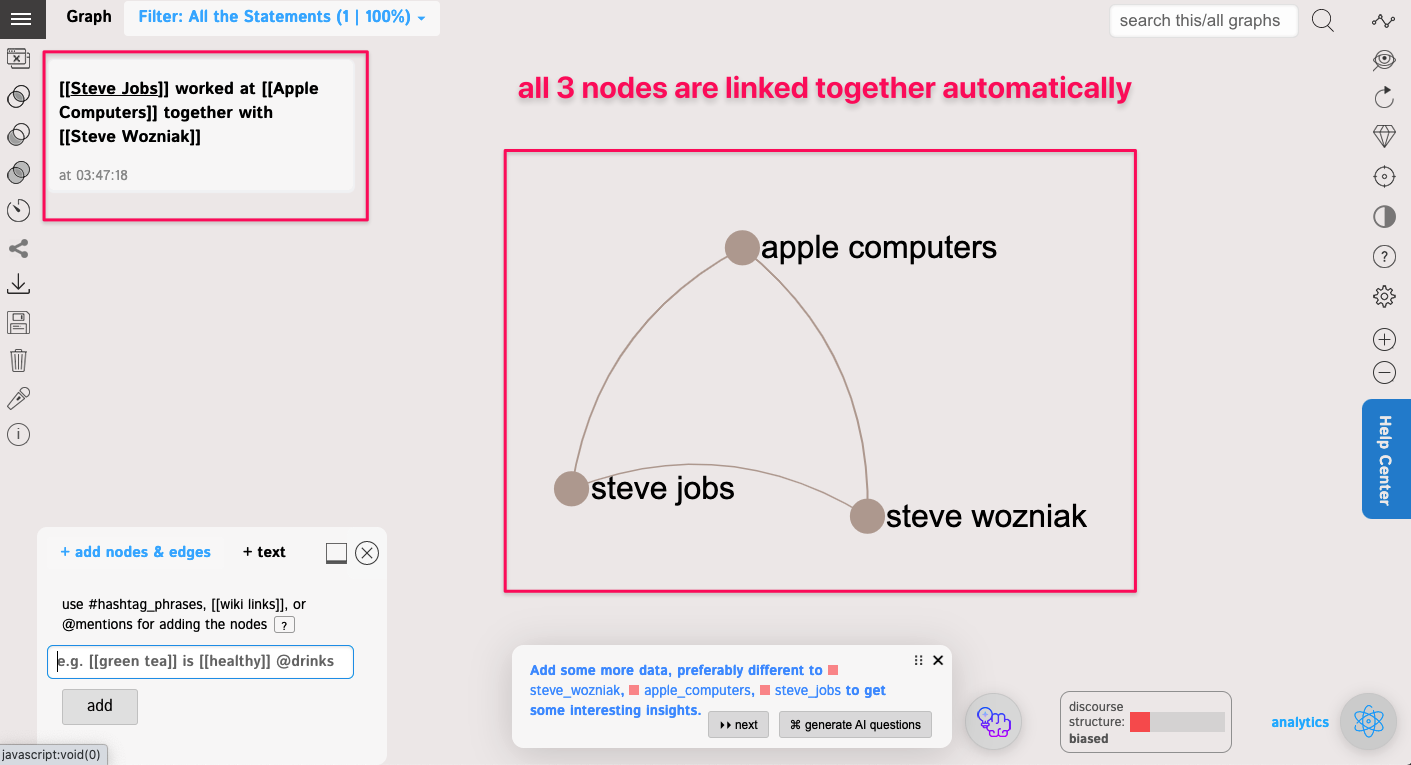
You can continue using this syntax and add more data to this graph.
For example,
@apple_computers produced #macs and [[iphones]]
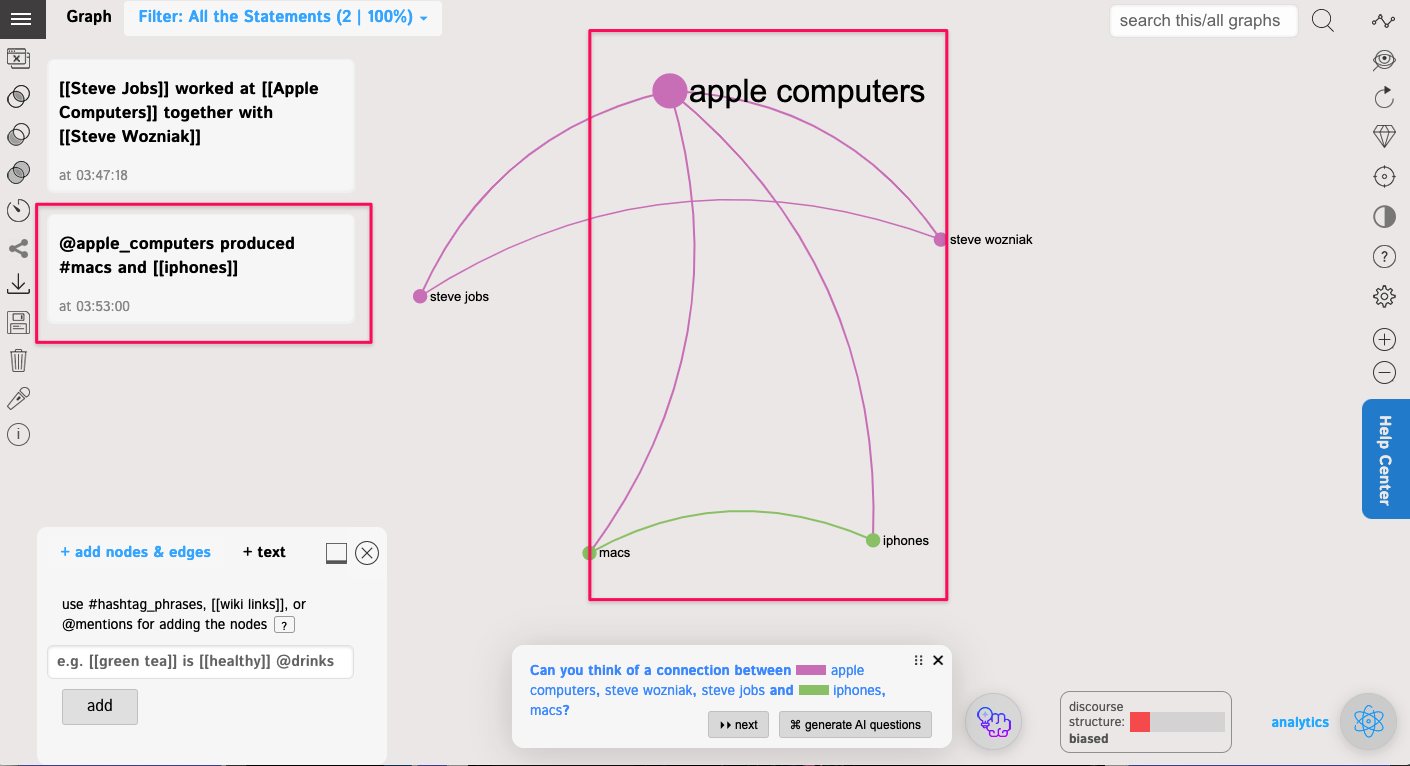
As you can see, here we used all the 3 different syntaxes: #hashtag_phrases, @mentions, and [[wiki links]].
If you put any of those in one line, they will be connected on the graph. If you want to add them separately, simply add them one by one and then link them using the graph.
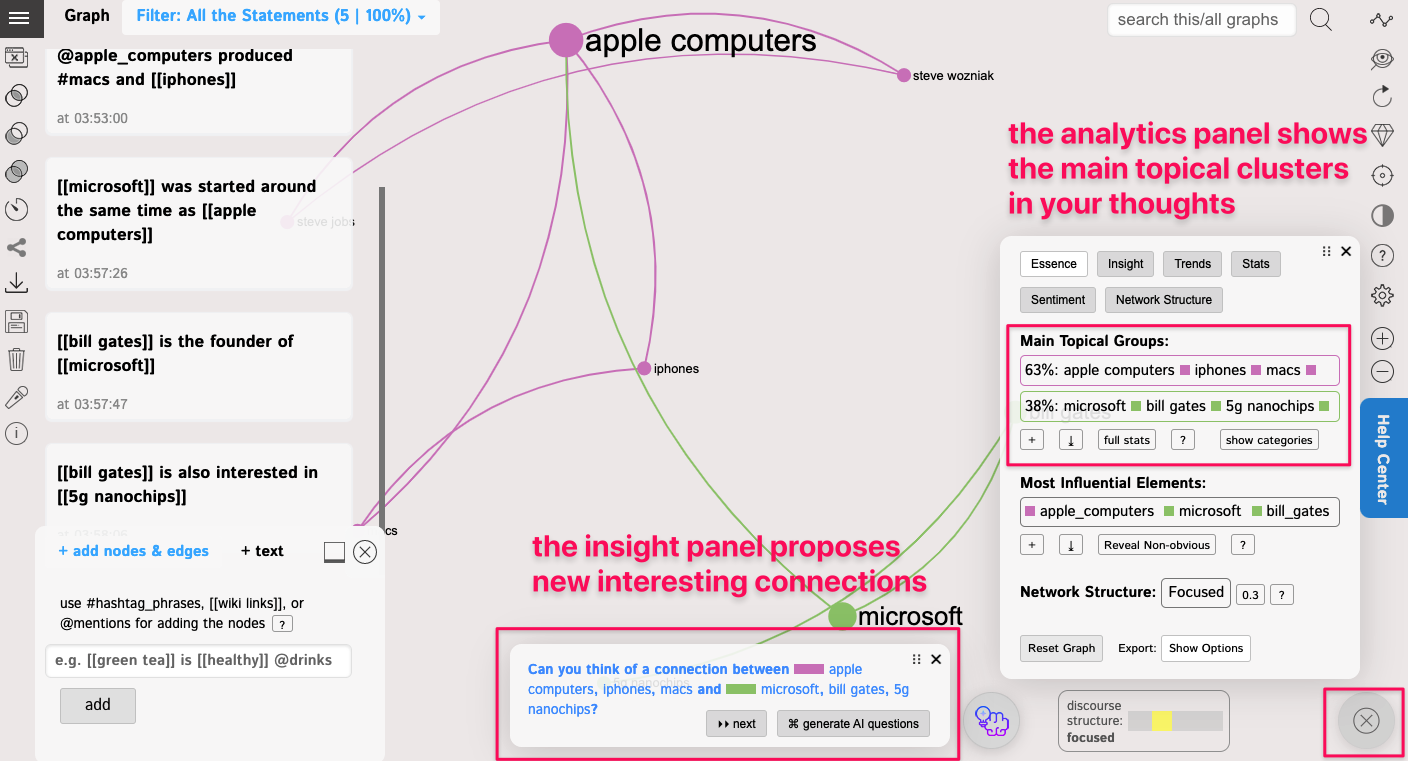
As you continue, you can add more and more data and build your mindmap. Gradually, you will see some insights about your ideas in the analytics panel on the right and can generate new ideas using the AI:
Approach #2. Using the Live Text-to-Mind map Editor:
You can also use plain text to build your mindmap. InfraNodus will convert every concept into a node and visualize it as a text graph.
For example, if you visualize a text like this:
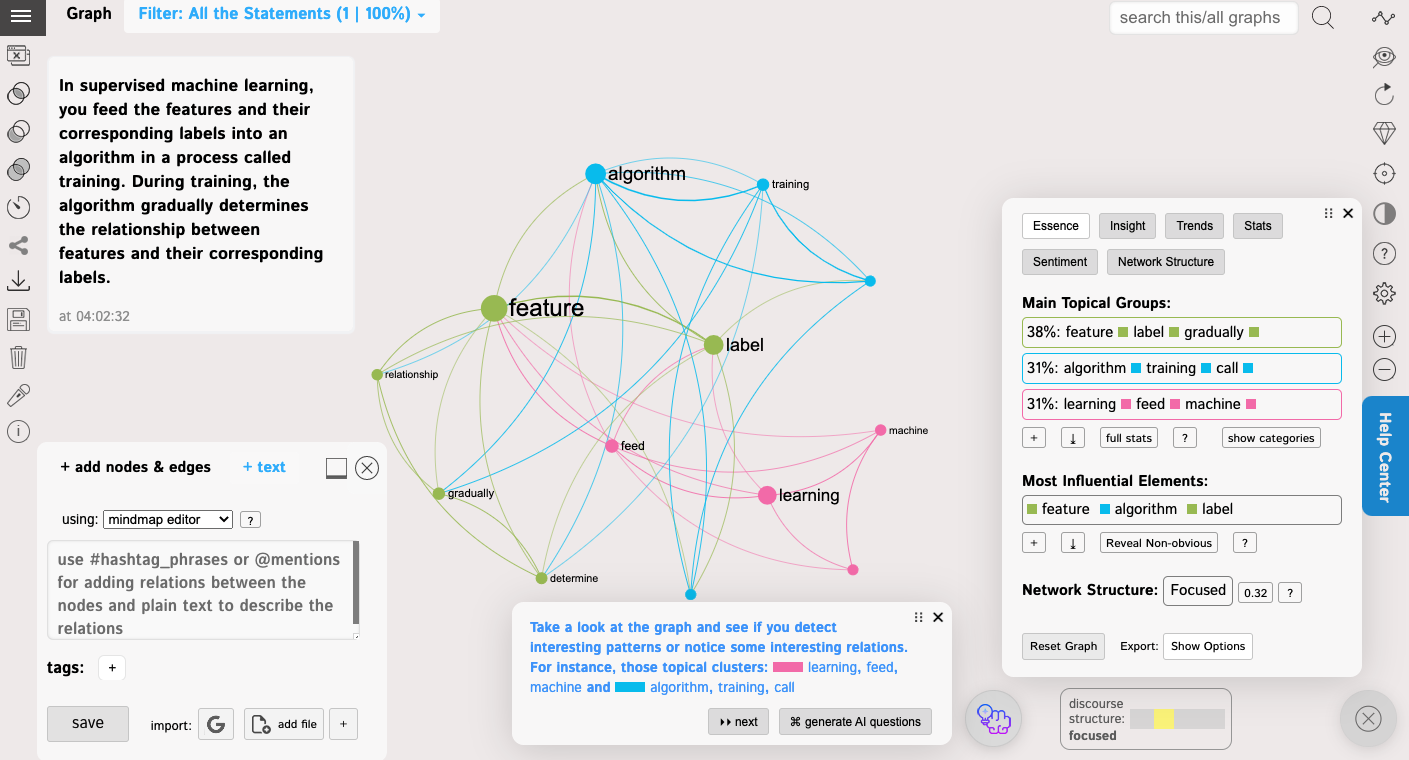
In supervised machine learning, you feed the features and their corresponding labels into an algorithm in a process called training. During training, the algorithm gradually determines the relationship between features and their corresponding labels.
If you add the texts as it is above, every word will be visualized as a node in the mind map.
If you want to control which entities are actually visualized, you can select the phrases or words that you want to visualize while you're adding a text, and they will be converted into hashtags. Only those words will then be added into the graph. All the words appearing in the same statement will be connected.
For example, if you type in your text and then select a few concepts like this:
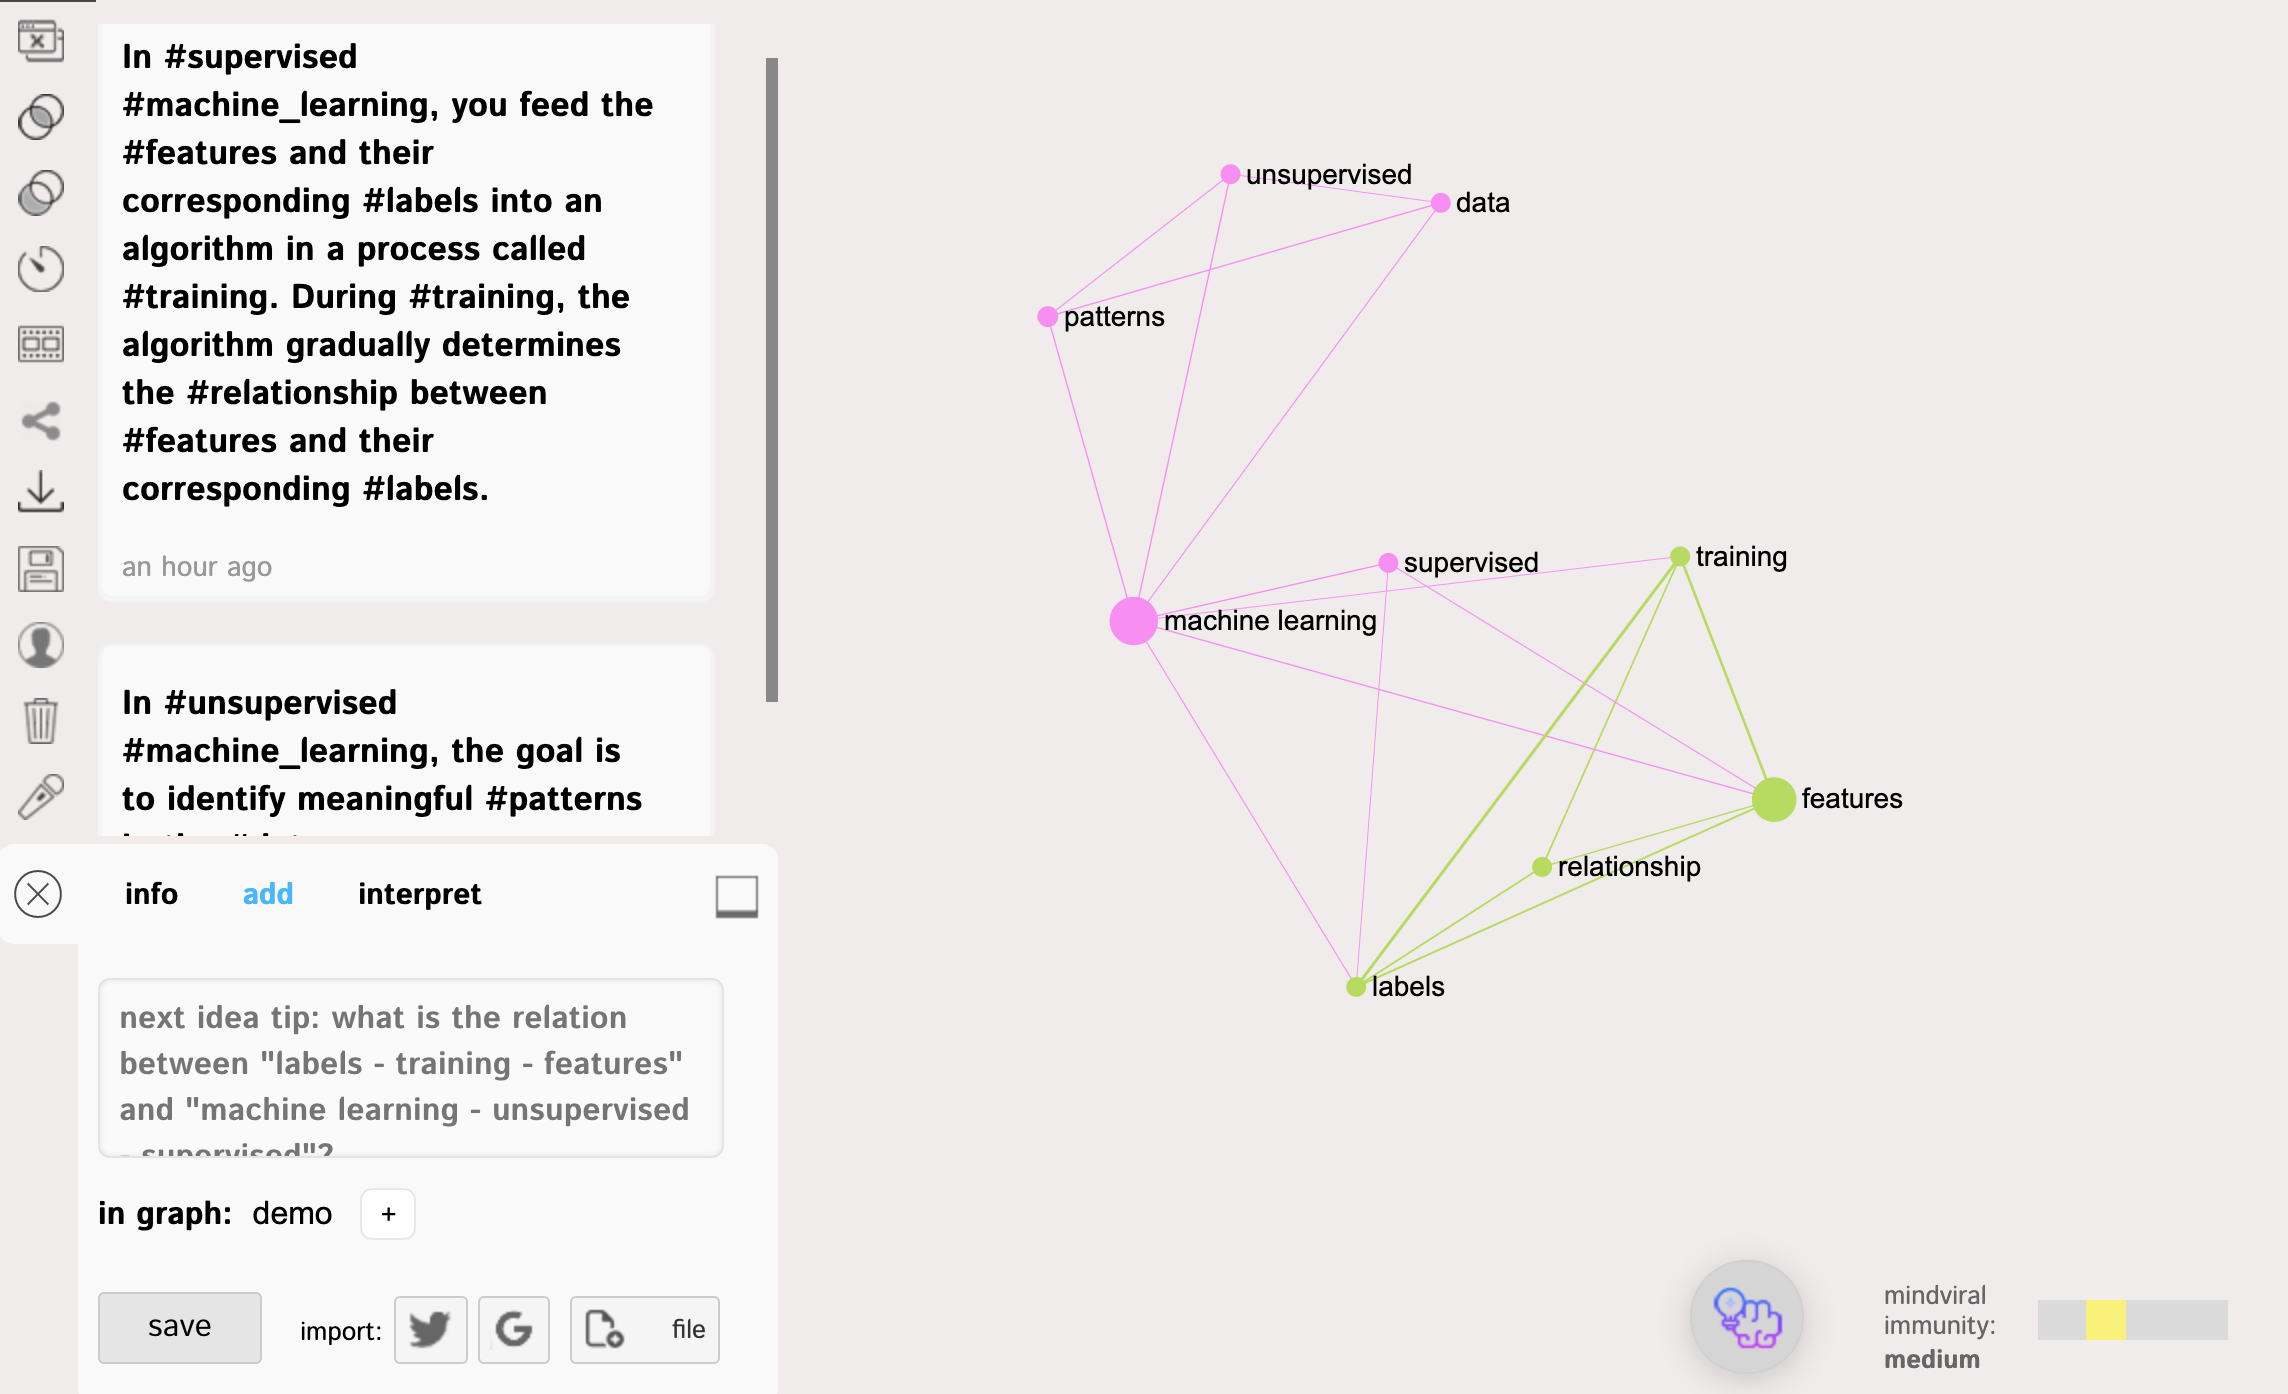
In supervised #machine_learning, you feed the #features and their corresponding #labels into an algorithm in a process called #training. During #training, the algorithm gradually determines the #relationship between #features and their corresponding #labels.
...you will add 5 distinct nodes and 9 relations between them:
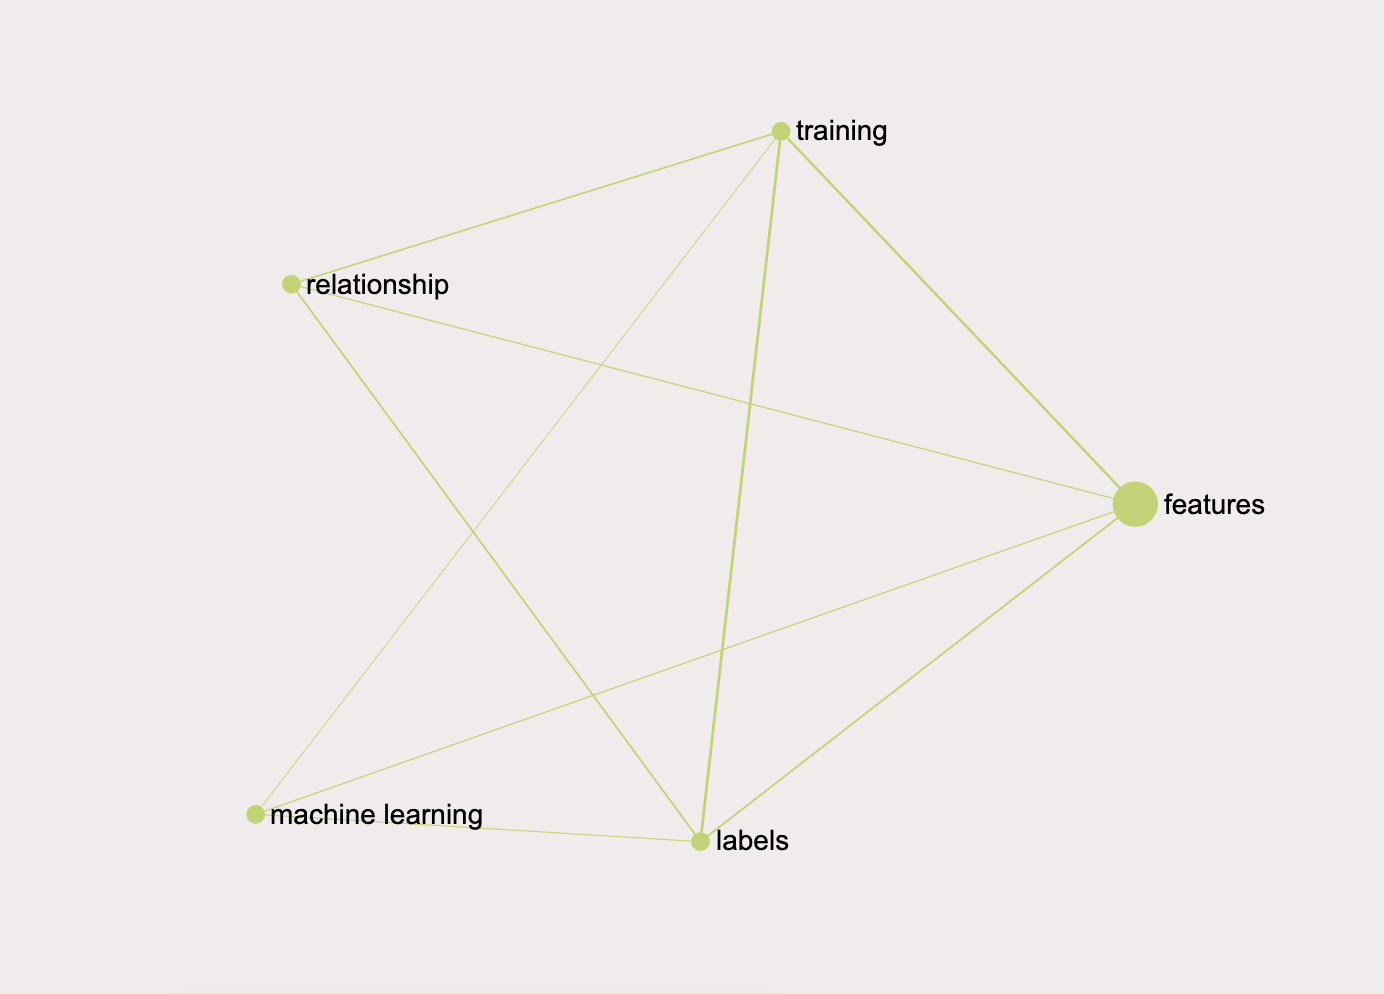
InfraNodus connects not only the concepts that are next to each other but also the words that have 1 or 2 concepts between to emulate the natural process of reading. The closer are the concepts, the stronger is the connection. You can switch this off in the user settings and instead choose to connect only the concepts that are next to each other.
Notice, how "training" and "labels" have the strongest connection. This is because that connection occurs the highest number of times in the graph. The next one is "training" and "features" and "labels" and features".
As you can see, this already provides a good representation of how the concepts are connected.
Note: For more control over this behavior, you can operate in single triplets of concepts. For example:
In supervised #machine_learning, you feed the #features and their corresponding #labels.
Here you will only have 3 nodes (machine_learning, features and labels) and they will all be connected to one another.
Step 3: Add More Text
Now that we added the first statement, we can add more stuff. For example:
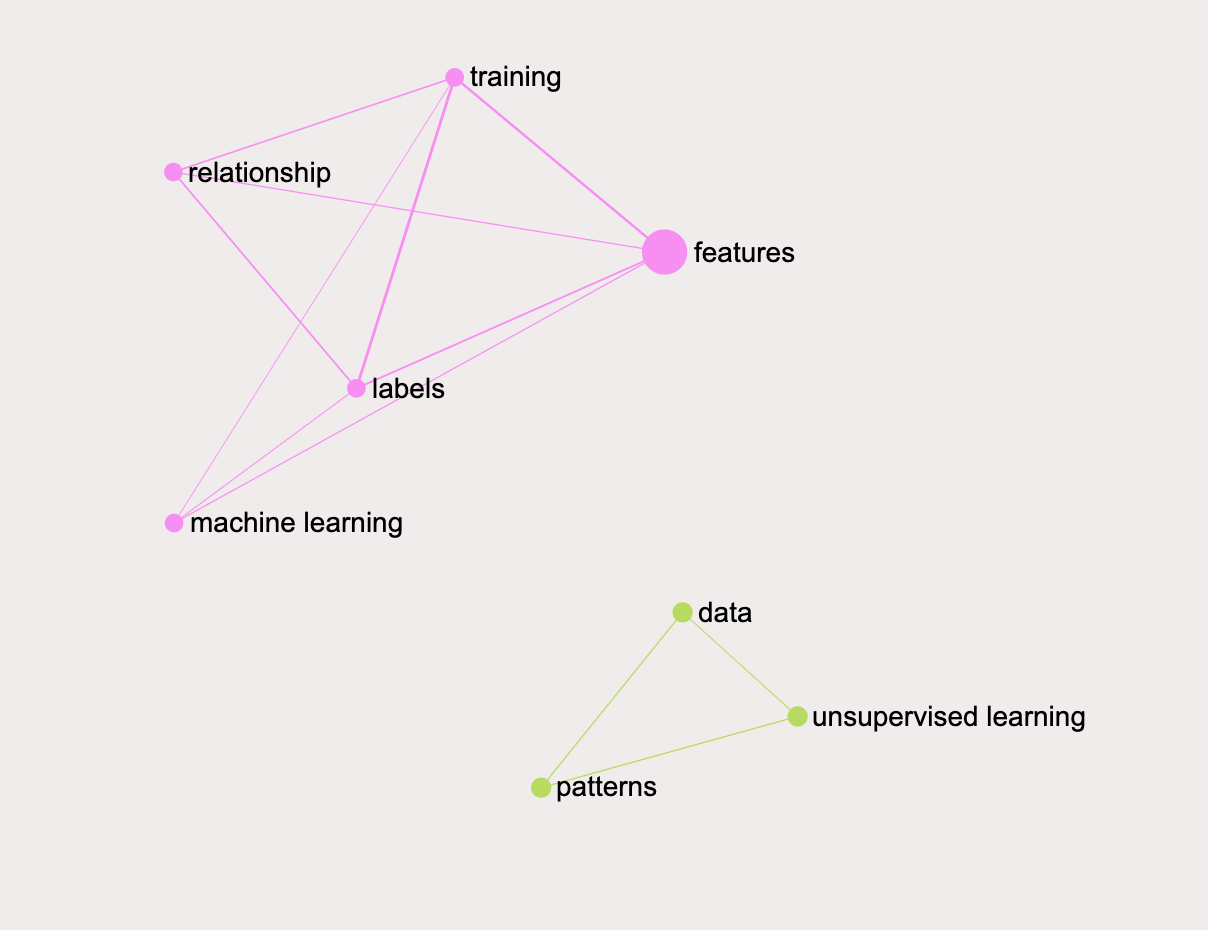
In unsupervised learning, the goal is to identify meaningful patterns in the data.
Let's now select "unsupervised learning", which will be converted into a concept like #unsupervised_learning, then also #patterns and #data. So we get something like this:
In #unsupervised_learning, the goal is to identify meaningful #patterns in the #data.
Then submit this statement and you will get something like this:
Step 4: Editing a Mind Map
Suppose now we realize that actually, we want to have a separate node for #machine_learning and separate nodes for #supervised and #unsupervised.
In that case we can simply
a) click the statement we want to edit, then
b) click the Edit link
c) edit the statement
d) save it back into the graph
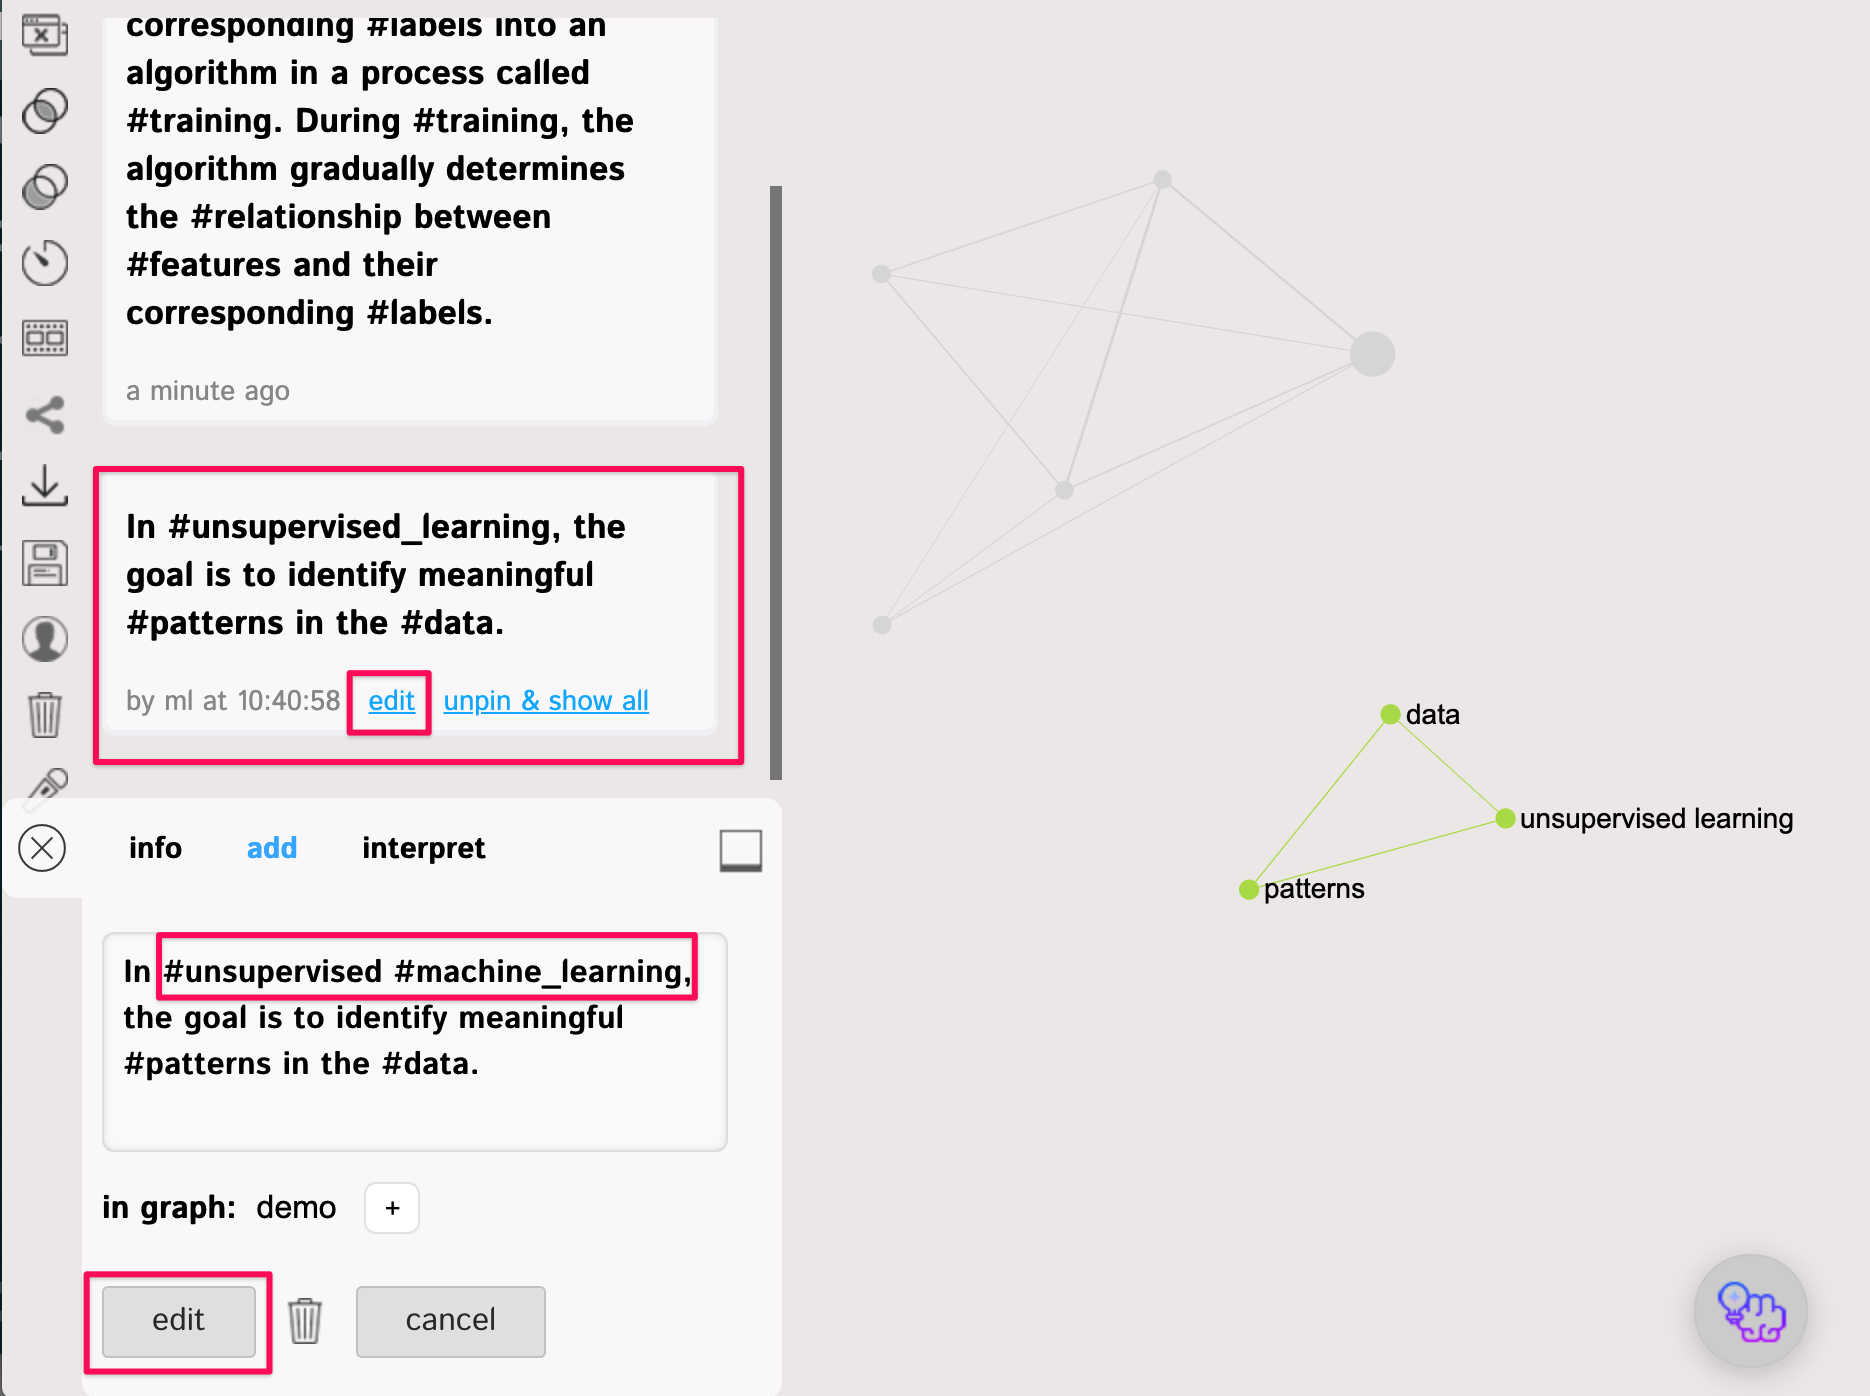
The result will look like this:
As you can see, now #machine_learning is the main concepts and it's connecting two distinct clusters: on supervised training (using features and labels) and unsupervised training.
Step 6: Use Analytics
Once you add more data, you will see some interesting patterns forming in the Analytics panel. It will show you the main topical clusters and the most influential nodes, using the metrics derived from network science (mainly betweenness centrality and community detection algorithms based on graph modularity).
Step 7: Use the AI-based Insight Generation Tool
You can also use the Insight Generation Tool to get a recommendation as to what could be a next interesting idea to think of in relation to this topic. This tool is based on identifying the structural gaps in the discourse network and asking the questions that are designed to bridge those gaps and to generate new ideas.
This tool also uses GPT-3 AI to generate interesting research questions that will bridge the structural gaps in your discourse.
Try this on https://infranodus.com and also see the article on mind mapping with InfraNodus.
Comments
0 comments
Please sign in to leave a comment.