

You can use InfraNodus to compare different text graphs in order to see how the graphs are similar / different from each other. Using this feature, you can also see which concepts are present in two or more graphs simultaneously or reveal the concepts / relationships that are only present in one graph but not in the other.
In general, there are 3 ways to put the graphs together:
1. Intersection of graphs
You can show the graphs' intersections with one another. This is useful when you want to find commonalities between the two or more discourses or estimate how similar two documents are.
Intersection mode will highlight the nodes that belong to all the graphs you're comparing, so you can see the nodes / concepts that belong to all the graphs you selected. You can choose more than 2 graphs for that feature.
In order to do that, click the graph comparison dialogue in the left menu, then choose "Intersects With" and select the graph(s) you want to compare your original graph to.
The resulting graph will highlight the concepts that are present in all of the graphs you selected at the same time. The Analytics > Gap Insight panel on the right will show the score for the texts' similarity and also show what's missing in one text when compared to the others:
2. Combination of Graphs
You can see several graphs at the same time. This is useful when you want to analyze several discourses or documents at once but you imported them into separate contexts.
To do that, select the graph compare menu and then choose "Combines With" in the dialogue:
This will merge the graphs you selected and show you a common visualization of them at the same time. You will see the topics and metrics for all of them at the same time.
Note: Filtering the Graphs
In both cases, you can also use the top menu to filter the graphs you selected, so you can see only one graph at a time. The statistics will be recalculated.
3. Embedding the Discourse
This comparison mode shows how well one discourse is embedded into another. The resulting visualization will highlight in Red how well your current graph (Graph A, the one you had opened first) is embedded into the other graph you selected (Graph B, the one you choose in the comparison feature)
For example, in the image below, you see how well the first graph (keywords used in the context of a "marketing research" search query) is embedded into Google search results for the same query. The red nodes show that the search intent is covering about half of the search results. The other half, not covered, is talking about industry insights and consumer products — something that people do not really search for but still find. This could be an indication of excessive informational supply or, on the other hand, of a lack of search intent in this direction.
You can also click the "Reverse" button indicated with purple at the top left (below the graph comparison button) to reverse the comparison and see how well Google search results fit into search intent.
The analytics panel on the right (the Insight Tab) shows some extra information about the missing items as a list of concepts.
4. Graph Differences
Graph differences is a really interesting feature that shows how different one graph is from the other. It shows which concepts from the graph you select for comparison are NOT present in the original graph you're viewing. This is really helpful for understanding how you could enrich your original discourse using the ideas from another discourse.
To open this dialogue, click the Compare Graphs button on the left and then choose "Differs To" in the options:
In the example below, we were on the graph of Google search results for the term "market research". We then opened the dialogue for graph comparison and selected the graph with keyword suggestions for that same query. The resulting graph shows us which terms are present in the keyword suggestions but not in the original Google search results graph. The analytics panel on the right (Analytics > Gap Insights) lists those terms. This helps us see what people search for but do not yet find:
Note, that if you want to reverse comparison (to see what's present in Google search results that is not present in search intent), you can click the Reverse Comparison button highlighted in the image above (top left).
As the graph differences feature is a bit more complex to use than the other one, we explain it in more detail below:
How to Find the Differences between the Text Graphs:
1. First, you need to define your datasets: what you will be comparing. It could be two different documents or your own text in relation to the general discourse. In our case we will compare a text on a certain subject ("feedback loops") in relation to the general discourse that exists online if we do a Google search on this subject.
2. Add your text to InfraNodus (using the text import or file import apps).
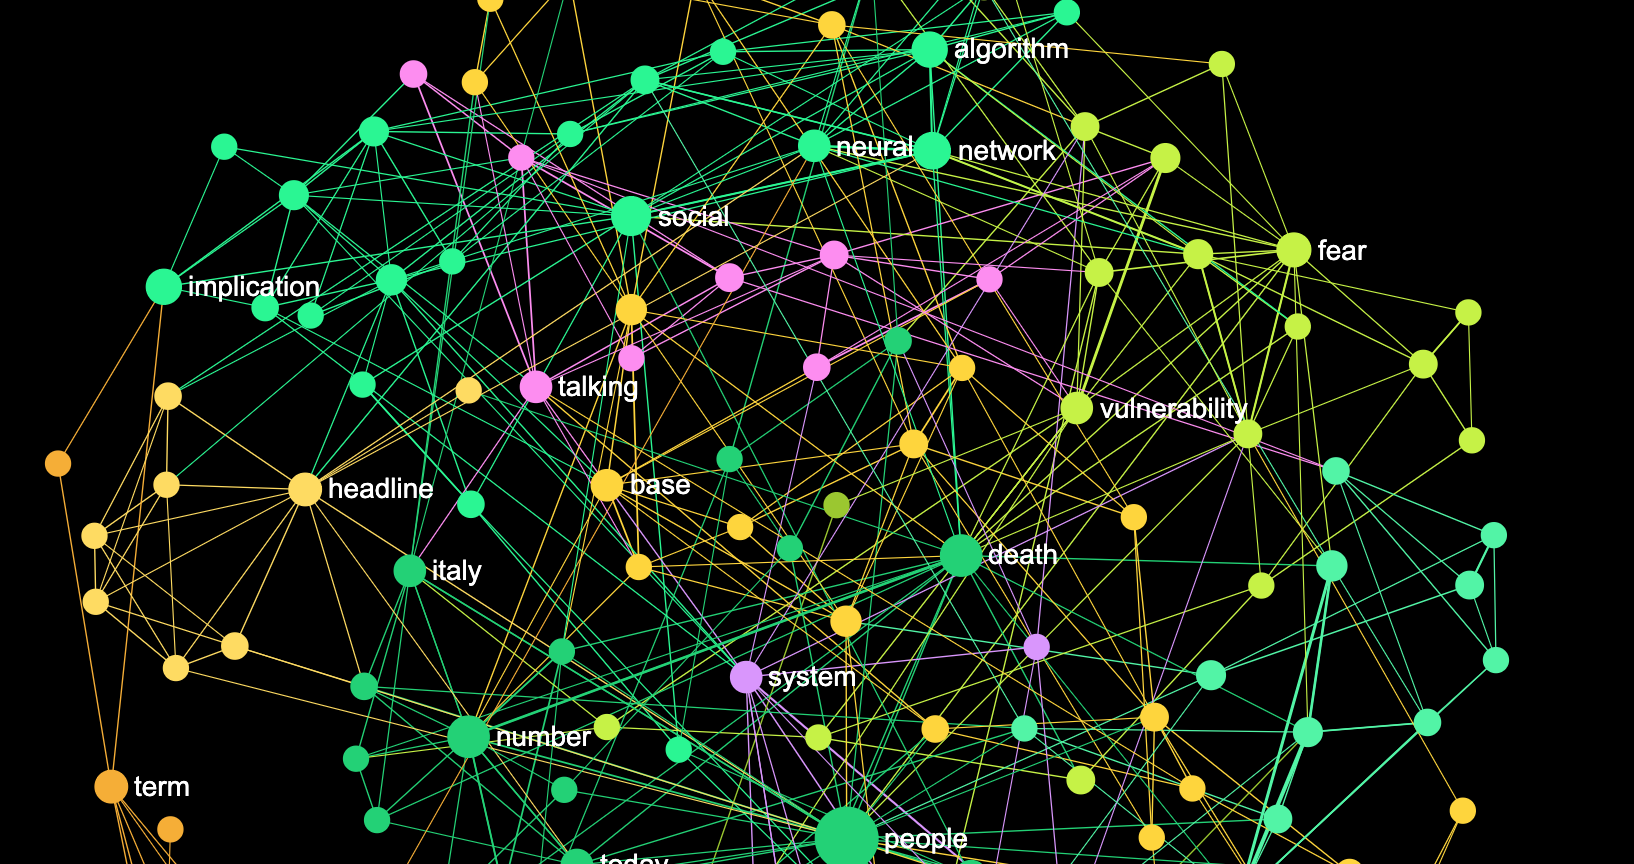
3. Your text will be visualized as a graph
4. Now add another dataset you want to compare it with. You can simply go to the Apps > Google Search App (Menu) or use the + Import Search field in the editor panel (bottom left).
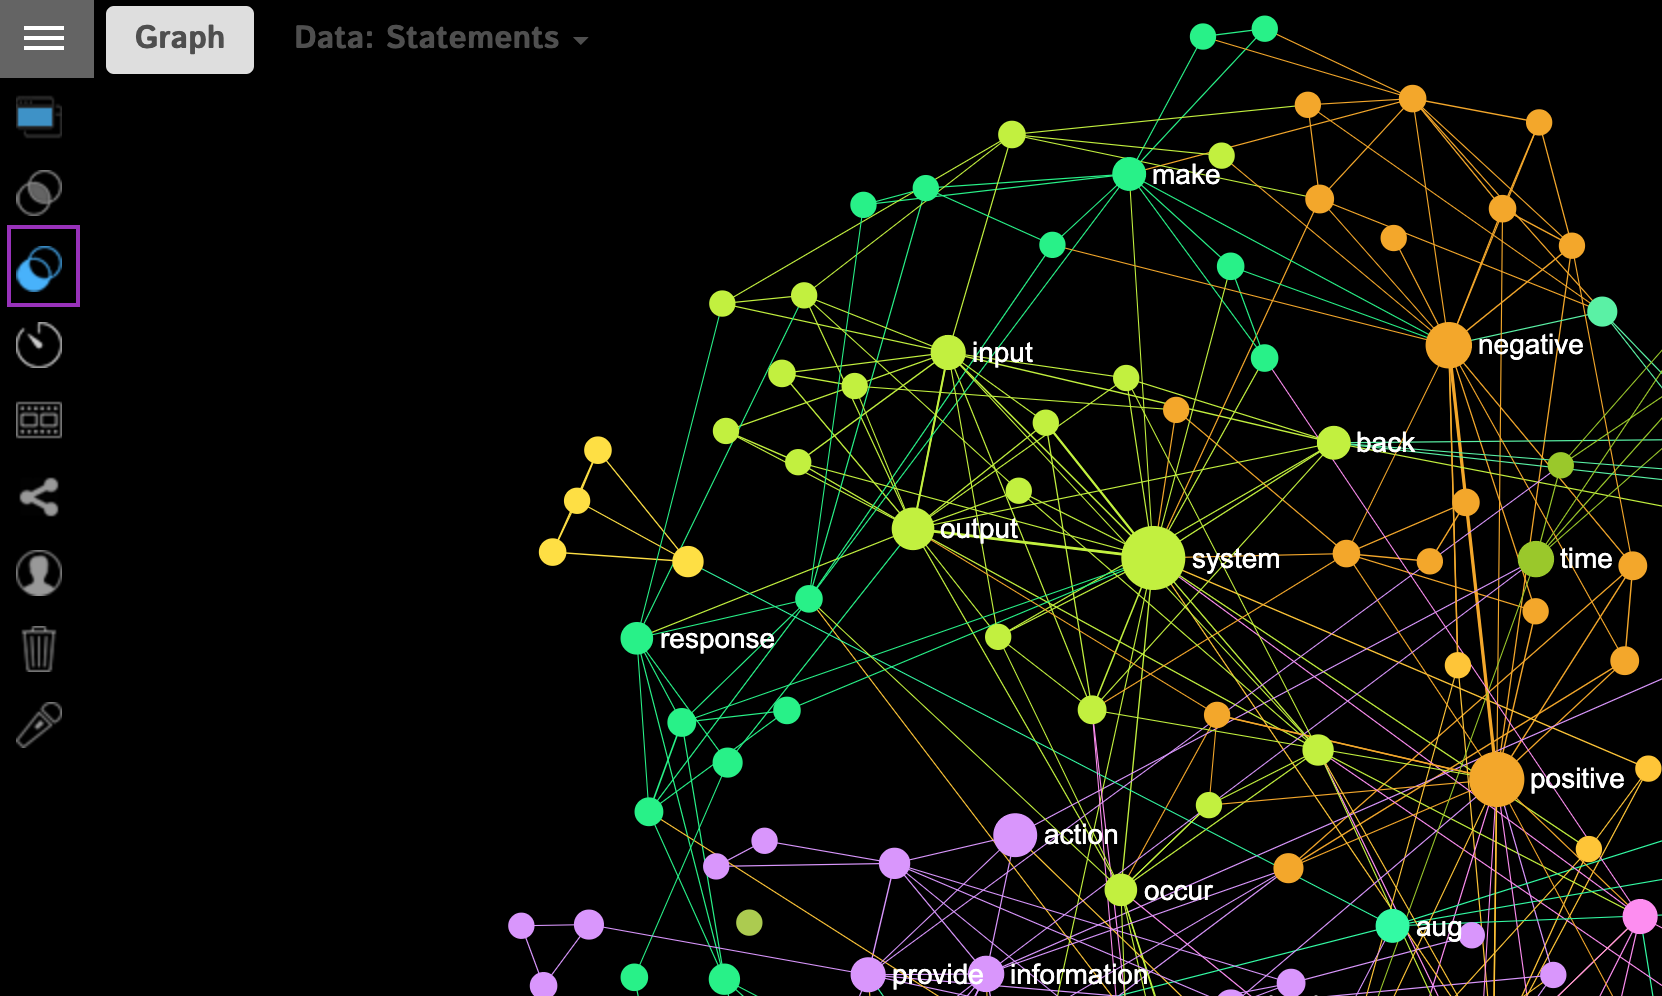
5. Once you added this new graph, click on the Statements Menu > Compare Contexts button. There are two options: to see what they have in common and to see the differences. Choose the button that shows the differences.
6. Then click the top left menu and choose the graph you want to compare it to (the previous one):
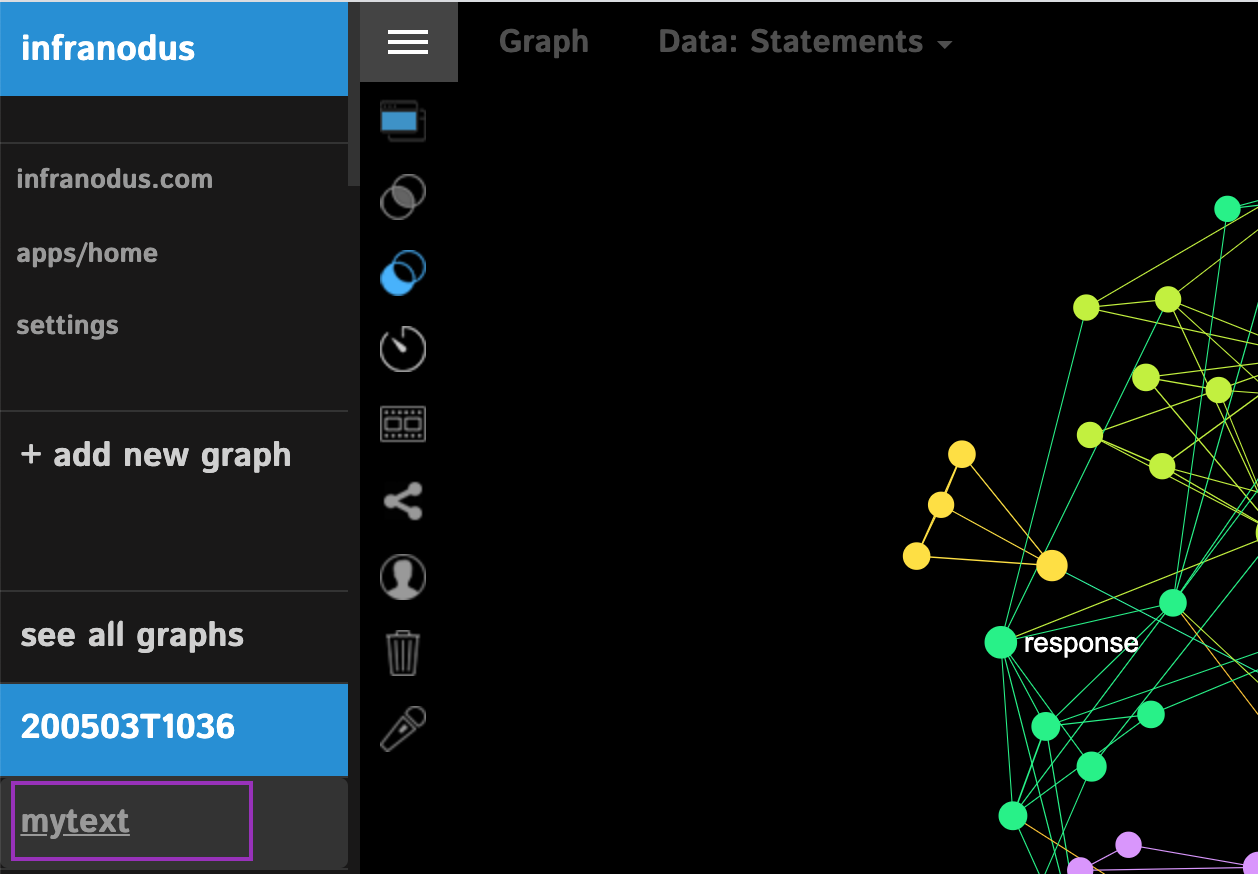
7. Click that graph / text and you will load a new graph that combines the both.
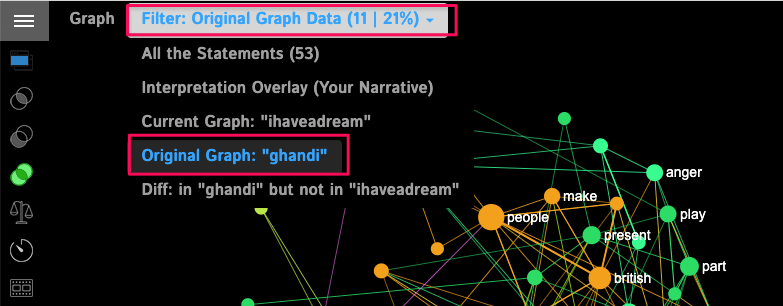
8. Then go to the top statements menu and choose Diff: Additional — Current to see a graph that only shows the difference between the new graph that you added and the one you were comparing it to: what exists in Google search results that does not exist in your original text:
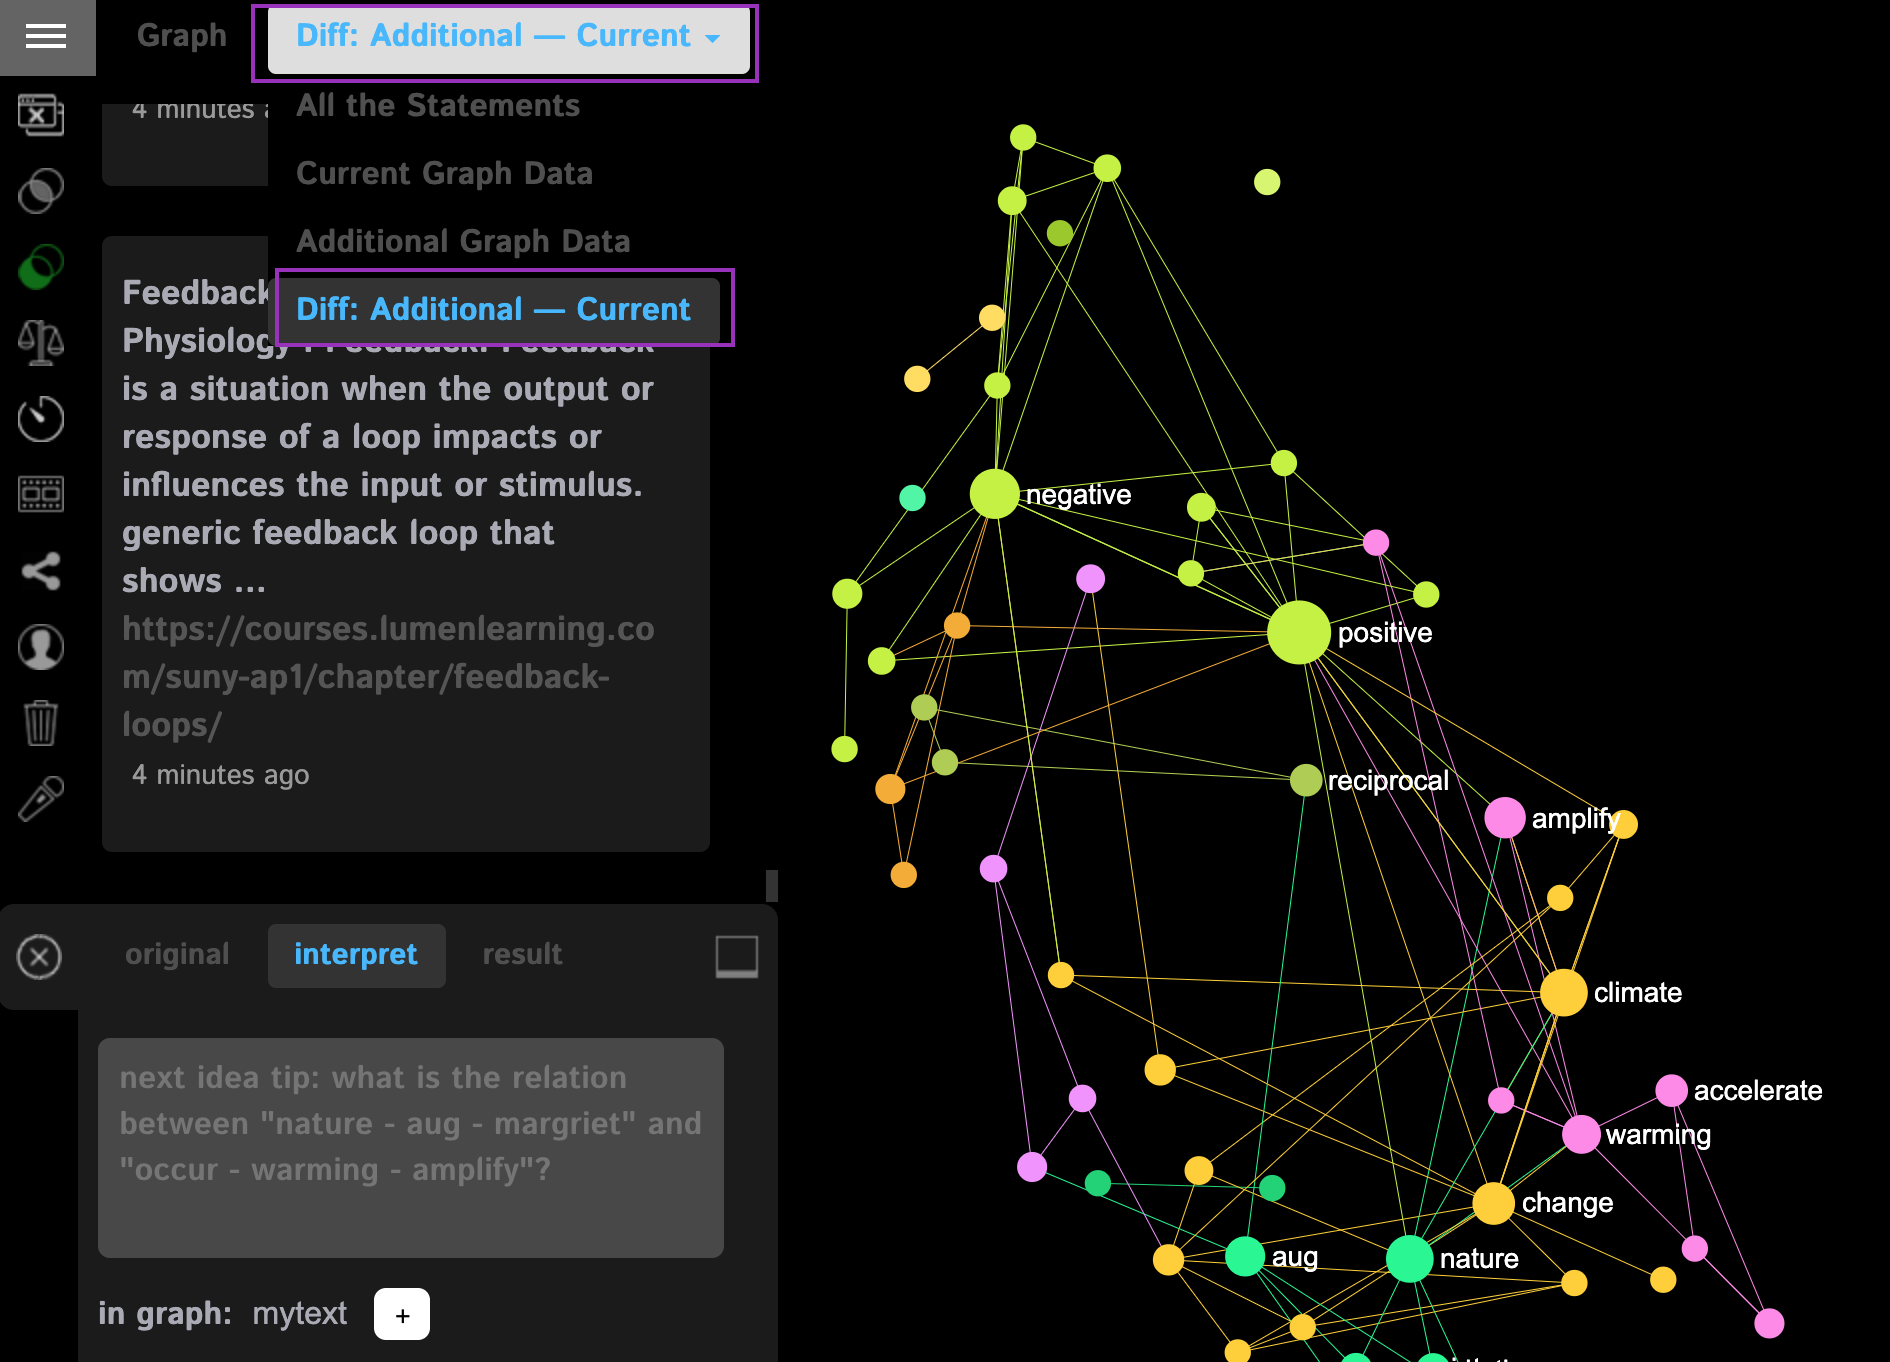
as you can see in our case it's
positive negative climate change nature
Which could be interesting to add into the original text to make it more relevant to the discourse that already exists on the subject.
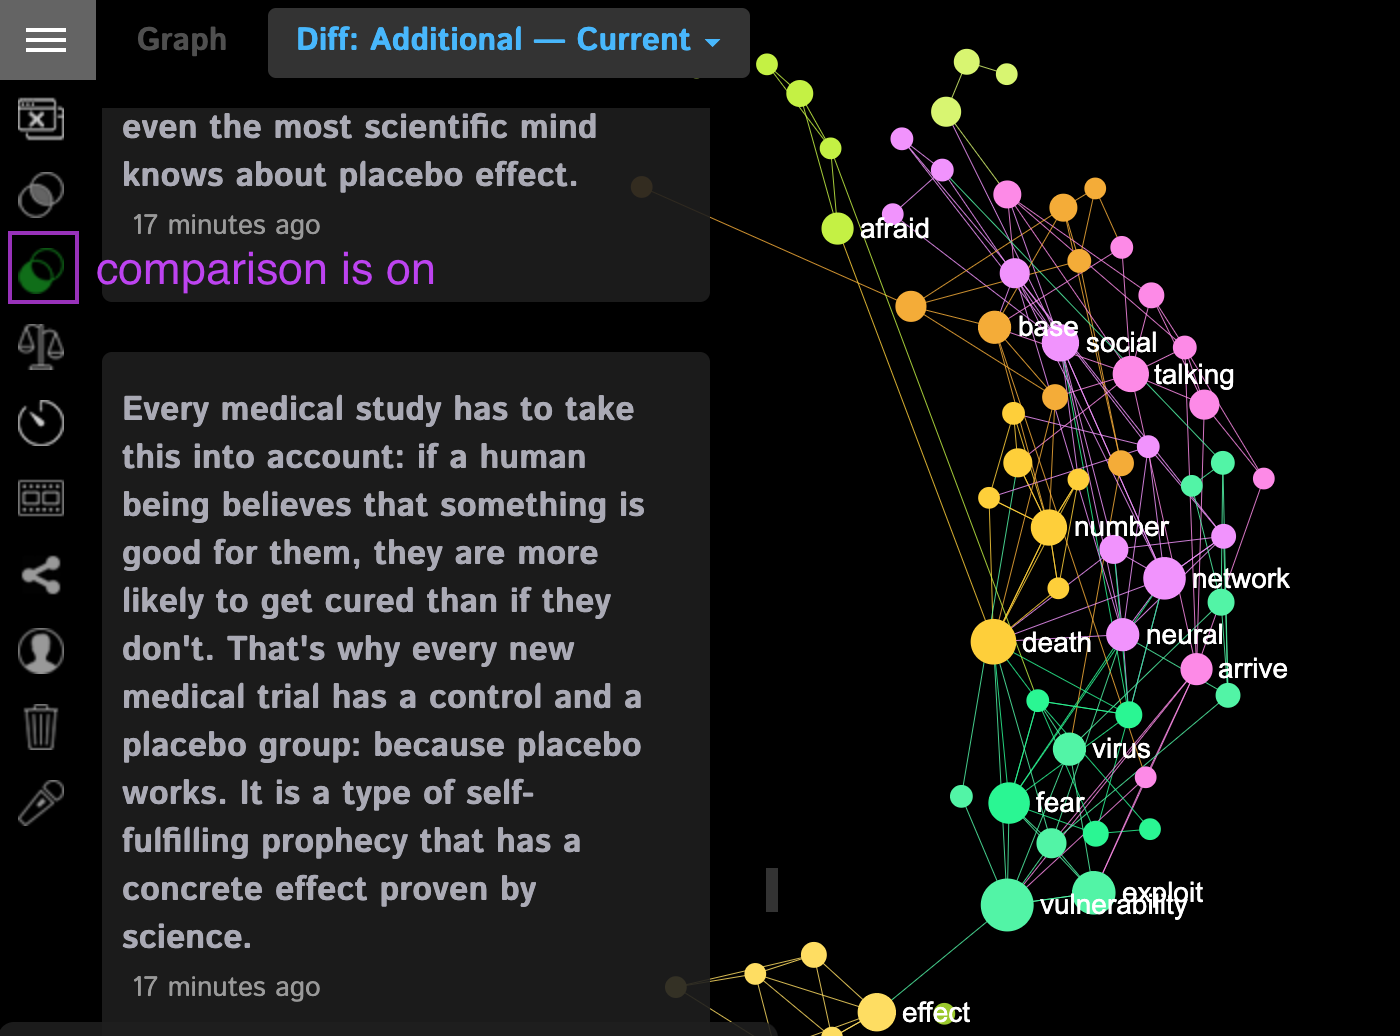
9. We can also reverse the comparison, so we can see what exists in our original text that is missing in Google search results on the subject (how is our text original). To do that, click the Text Control > Scales button (left menu):
10. We will then see the graphs the other way round:
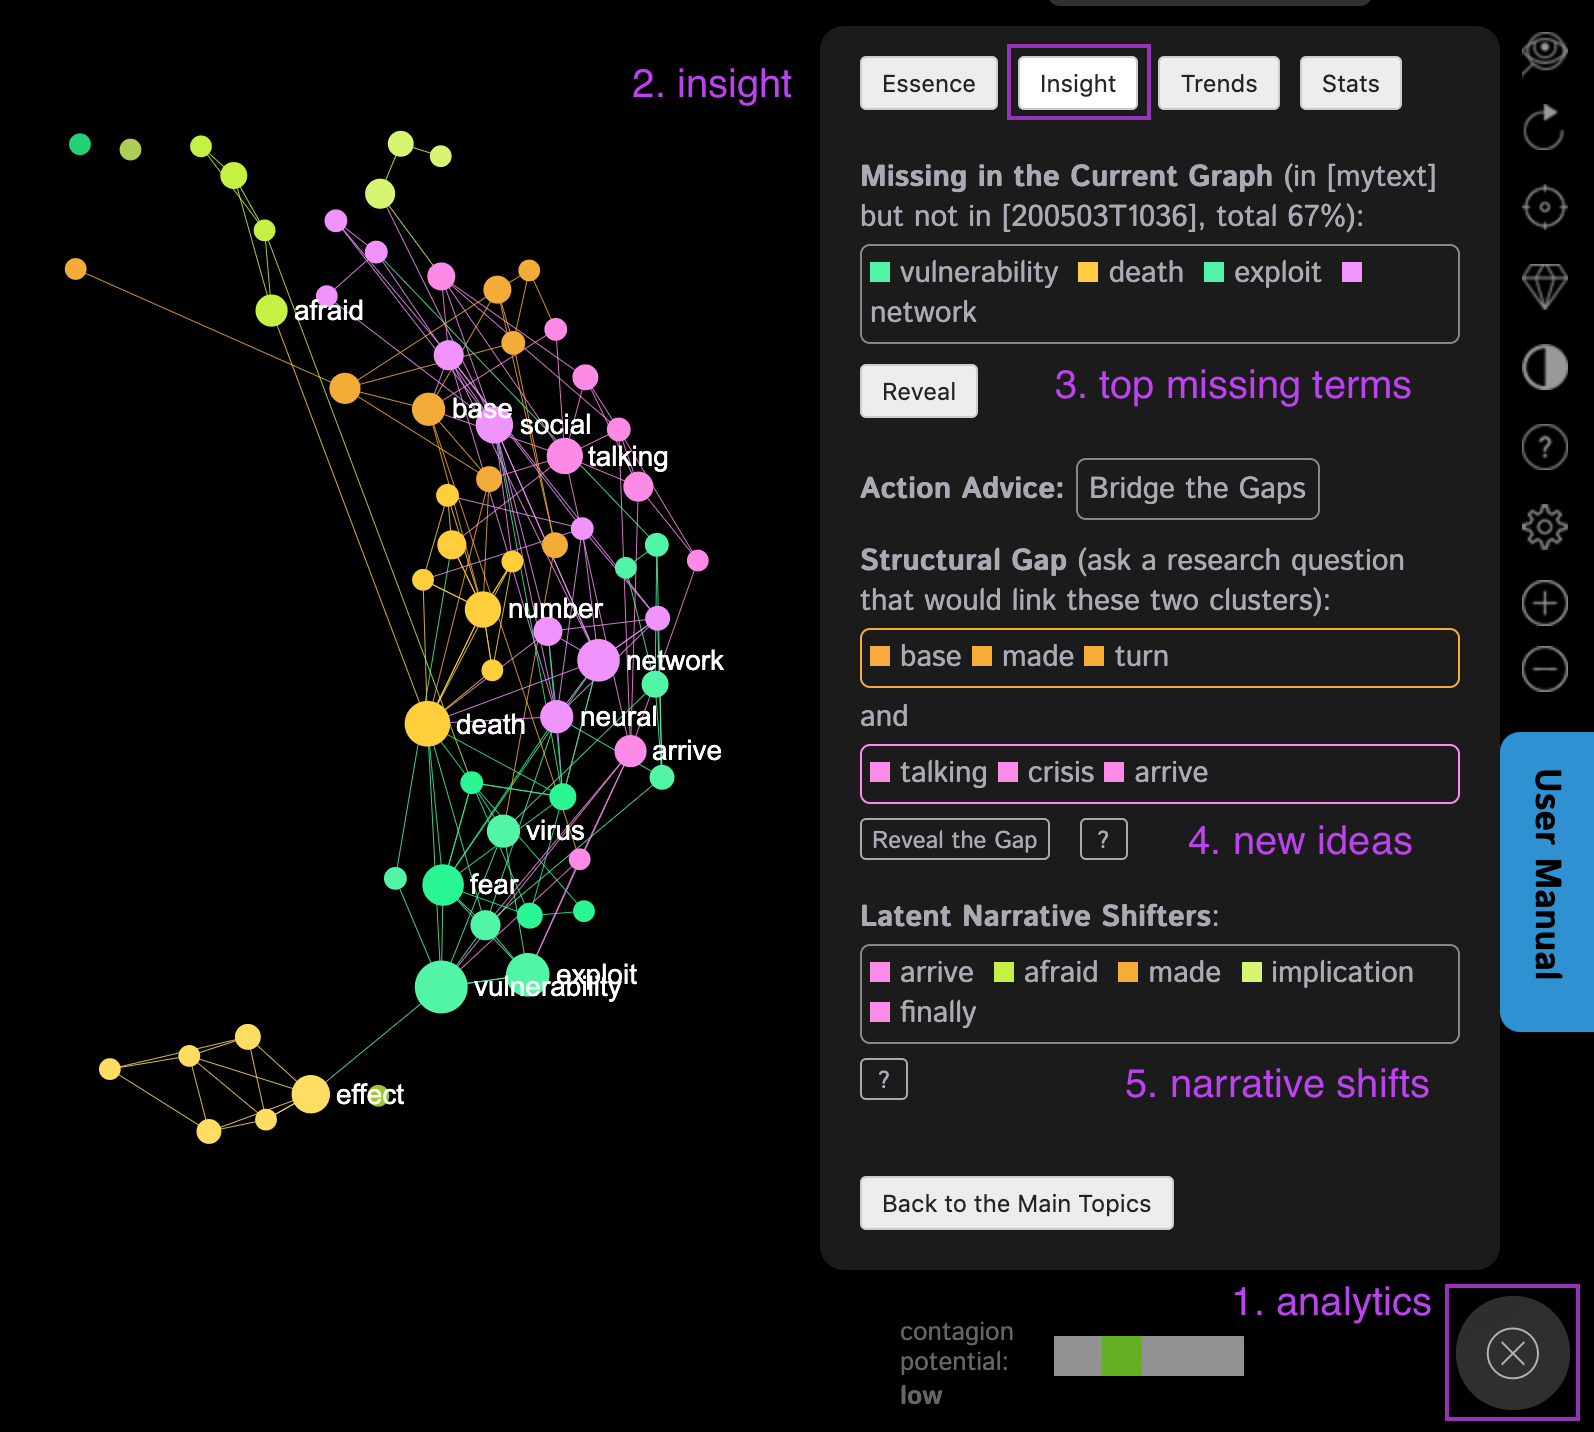
11. Click on the Analytics > Insight to see the most relevant missing terms, the structural gaps (new ideas), and the latent narrative shifters:
Comments
0 comments
Please sign in to leave a comment.