

If you go to the Apps section of InfraNodus and choose the SEO app, you can apply powerful text network analysis tools for search engine optimization.
Just type in your search query and InfraNodus SEO app will import:
1) Google search results for your query (SERP)
2) The search phrases that are most often used with this query (imported from Google)
You will then be able to see the missing content: what people search for but don't yet find — so that you know which content you can create to bridge the gap between the informational demand and supply.
You will also be able to save your keyword ideas as a separate graph, in order to design your SEO strategy.
SEO Step by Step Tutorial:
Here is more information about the four graphs you'll see:
Step 1. Choose the SEO App on the Apps page.
Step 2. Type in the search query you're interested in. Start with something more or less general, like "beauty products" or "health" or "search engine optimization":

Note, that you can choose the language of the search results you are analyzing (English, German, French, Russian, Spanish, Portuguese, Swedish) and the country you want to analyze the search results for (USA, UK, France, Germany, Brazil, Spain, and other countries).
You also have a choice to build a graph of the search results vs. related queries or the search results vs. Google Adwords suggestions.
Step 3. InfraNodus then automatically imports the Google search results in one graph and keyword suggestions into another and then shows you both graphs:

Step 4. Once the graphs are shown, open the Analytics panel on the right and check out the most influential terms and topics.
As we can see, the main topics are:
• cosmetic skincare brand
• makeup store
• natural
• skin care shop
This way we can quickly get an idea of what people search for and what they find. We can see the topic of "beauty products" is related to cosmetic skincare, makeup stores, natural cosmetics, and skin care shops.
Step 5: Use the menu at the top to see the different graphs to see the current informational supply, demand, and the difference between them:
1. Google Search Results Visualization — Informational Supply
This graph takes the first 40 results from the Google search results for your query (SERP) and visualizes them as a graph, using our text network analysis algorithm. The words are the nodes and the co-occurrences are the connections between them. When you click on this graph you can see the current informational supply — what people find when they search for this query.

2. Related Search Phrases — Information Demand
The second graph shows what people search for in relation to this search query. These are the search suggestions you can see in Google when you type in a search query. They show what else people search for when they search for a certain topic. You can use this graph to see the current informational demand — what people actually look for:

As you can see, while the search results have the prevalence of "natural" and "fragrance", search queries are more about coupons and discount codes, as well as wholesale distributors.
This may have an effect on your marketing strategy as you can see that people would actually be more interested to get a discount than learn about the natural aspects of beauty products.
As an option, you can choose to get the recommendations generated by Google AdWords keyword suggestion tool when you use the InfraNodus SEO tool. The difference is that instead of the related search queries you'll get the suggestions from Google AdWords, which may further enhance your research.
3. Missing Keywords
This third graph shows the difference between what people see when they type in the search query (the first graph) and what they actually search for (the second graph). It indicates the keyword combinations that people are searching for but don't find when they look for specific products.
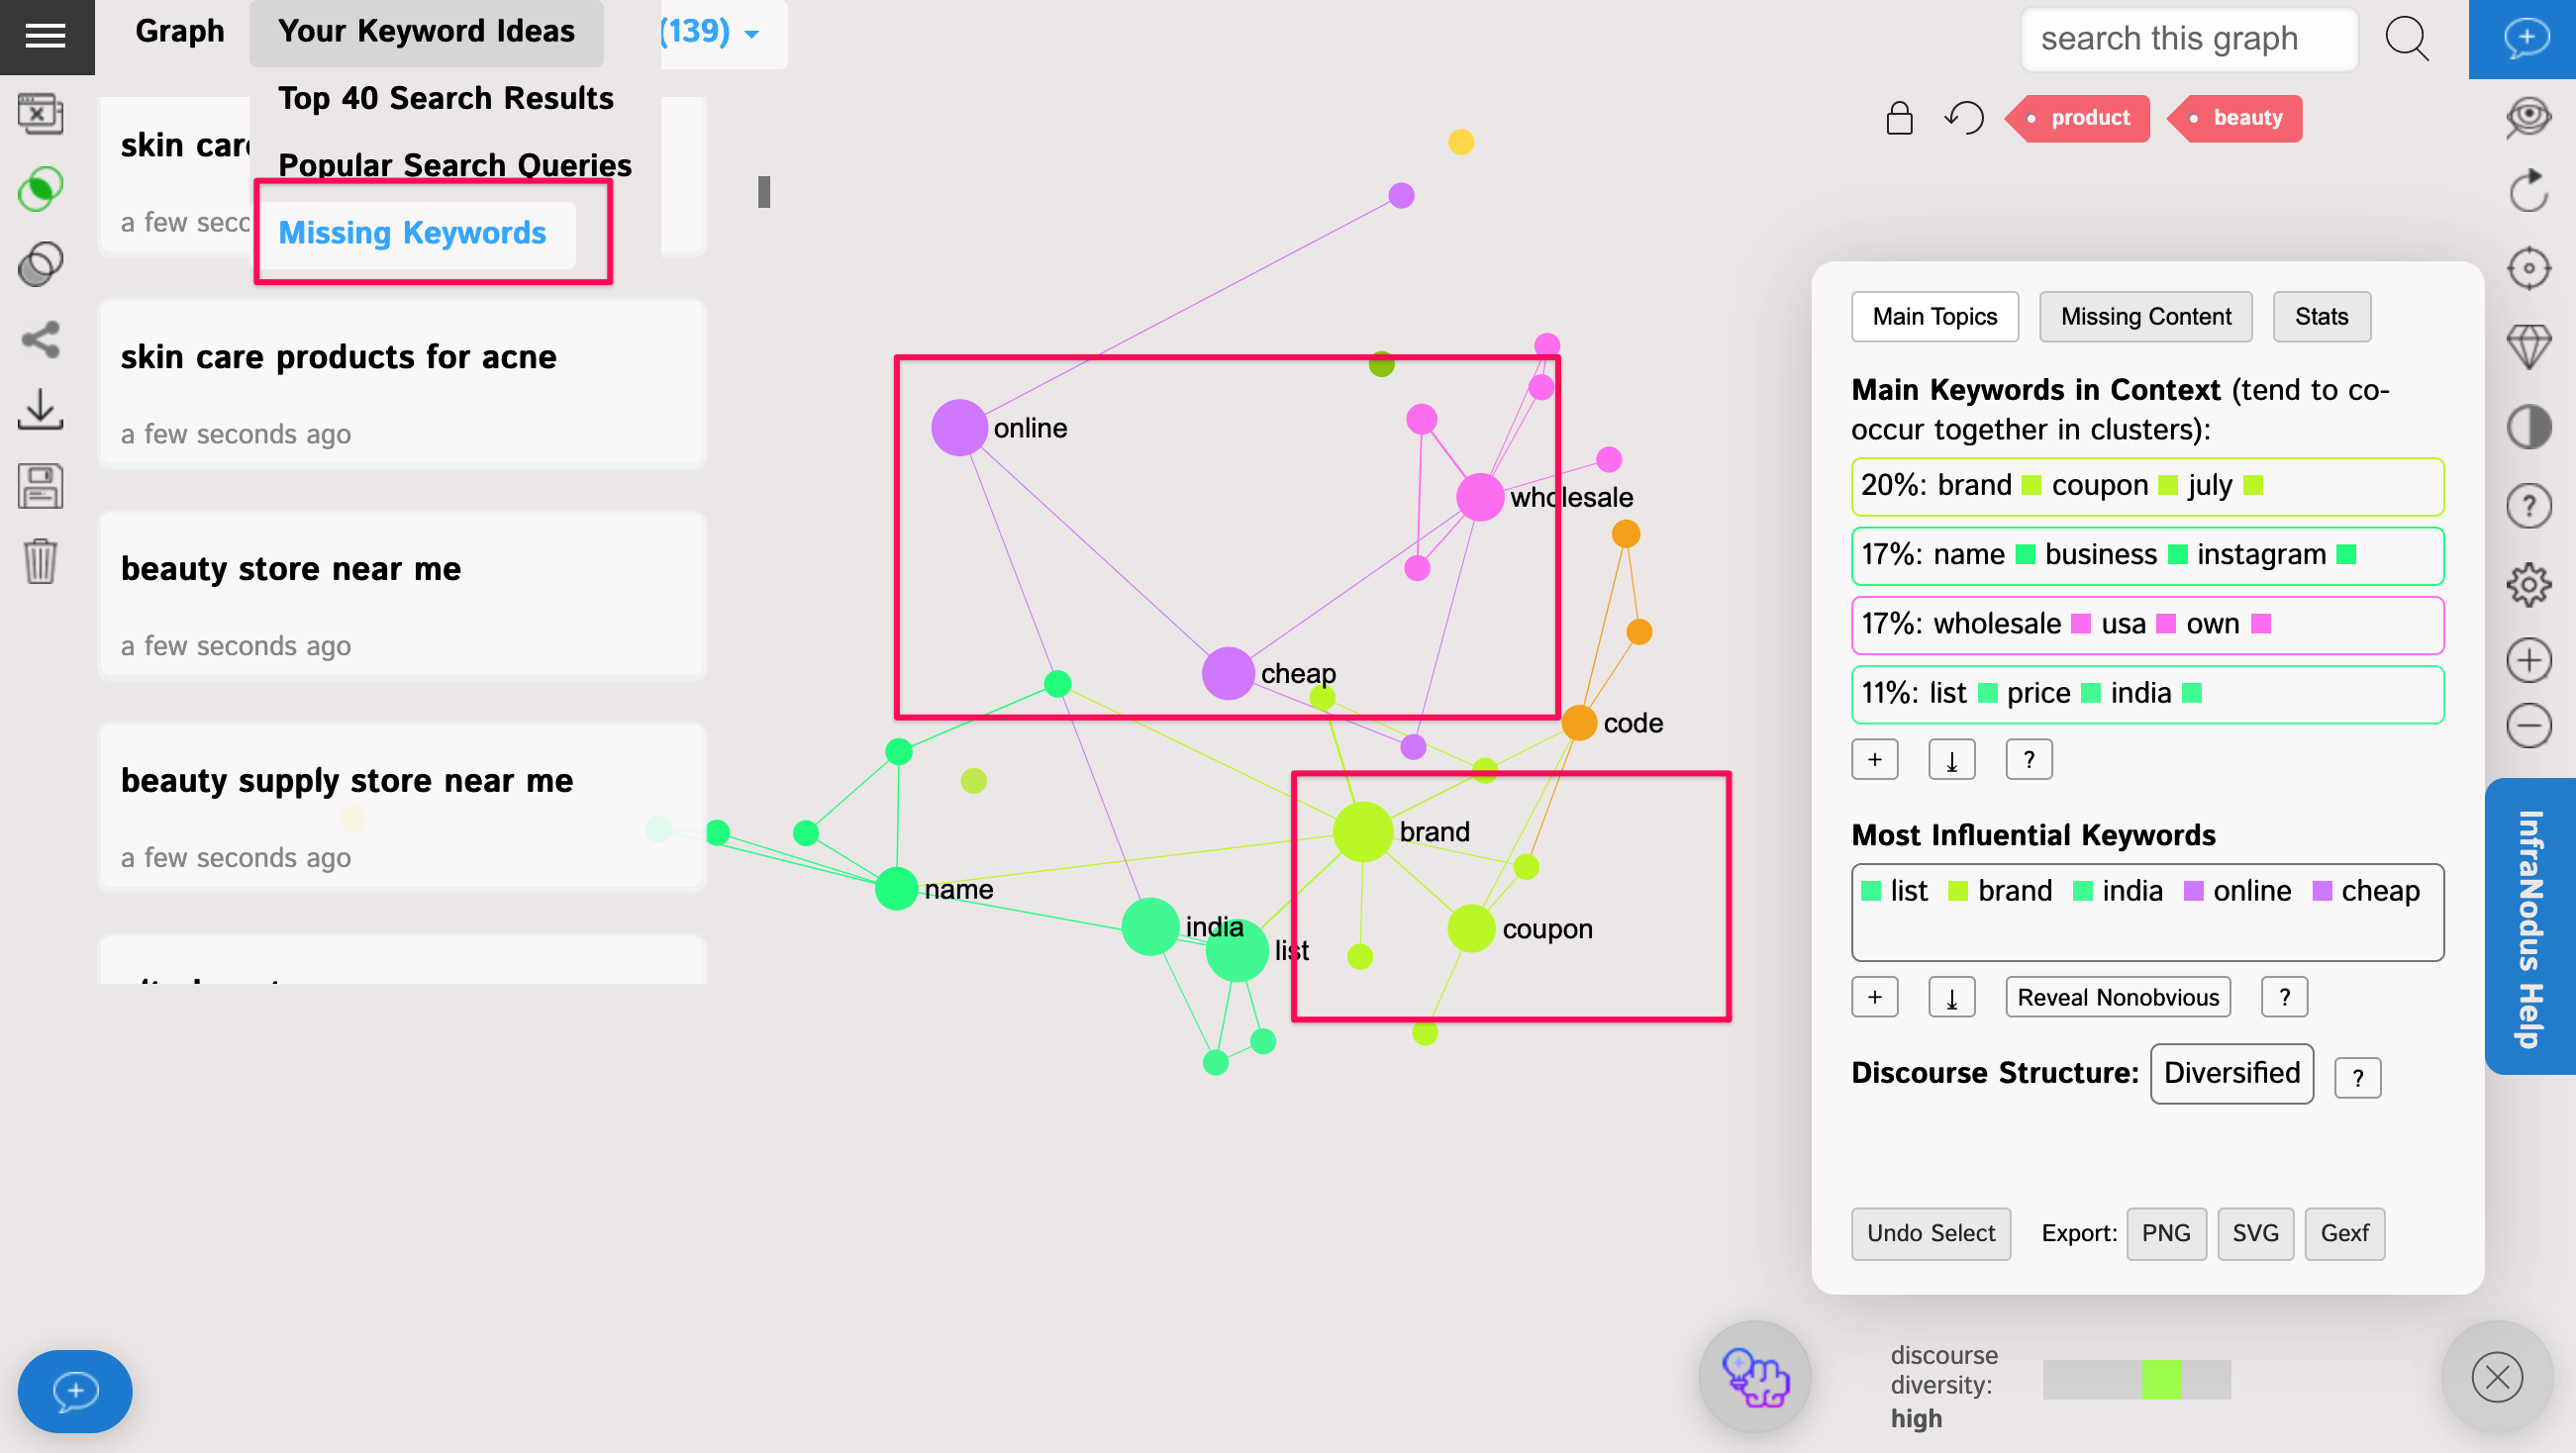
Choosing to target those keywords in your content strategy will almost guarantee you to get your products to the top of the search results (we've done it many times for our own Nodus Labs content and it always helped us modify the content of the articles to make them more relevant to what people are searching for).
Step 6: Click on the nodes in the graph to see the context the keywords appear in
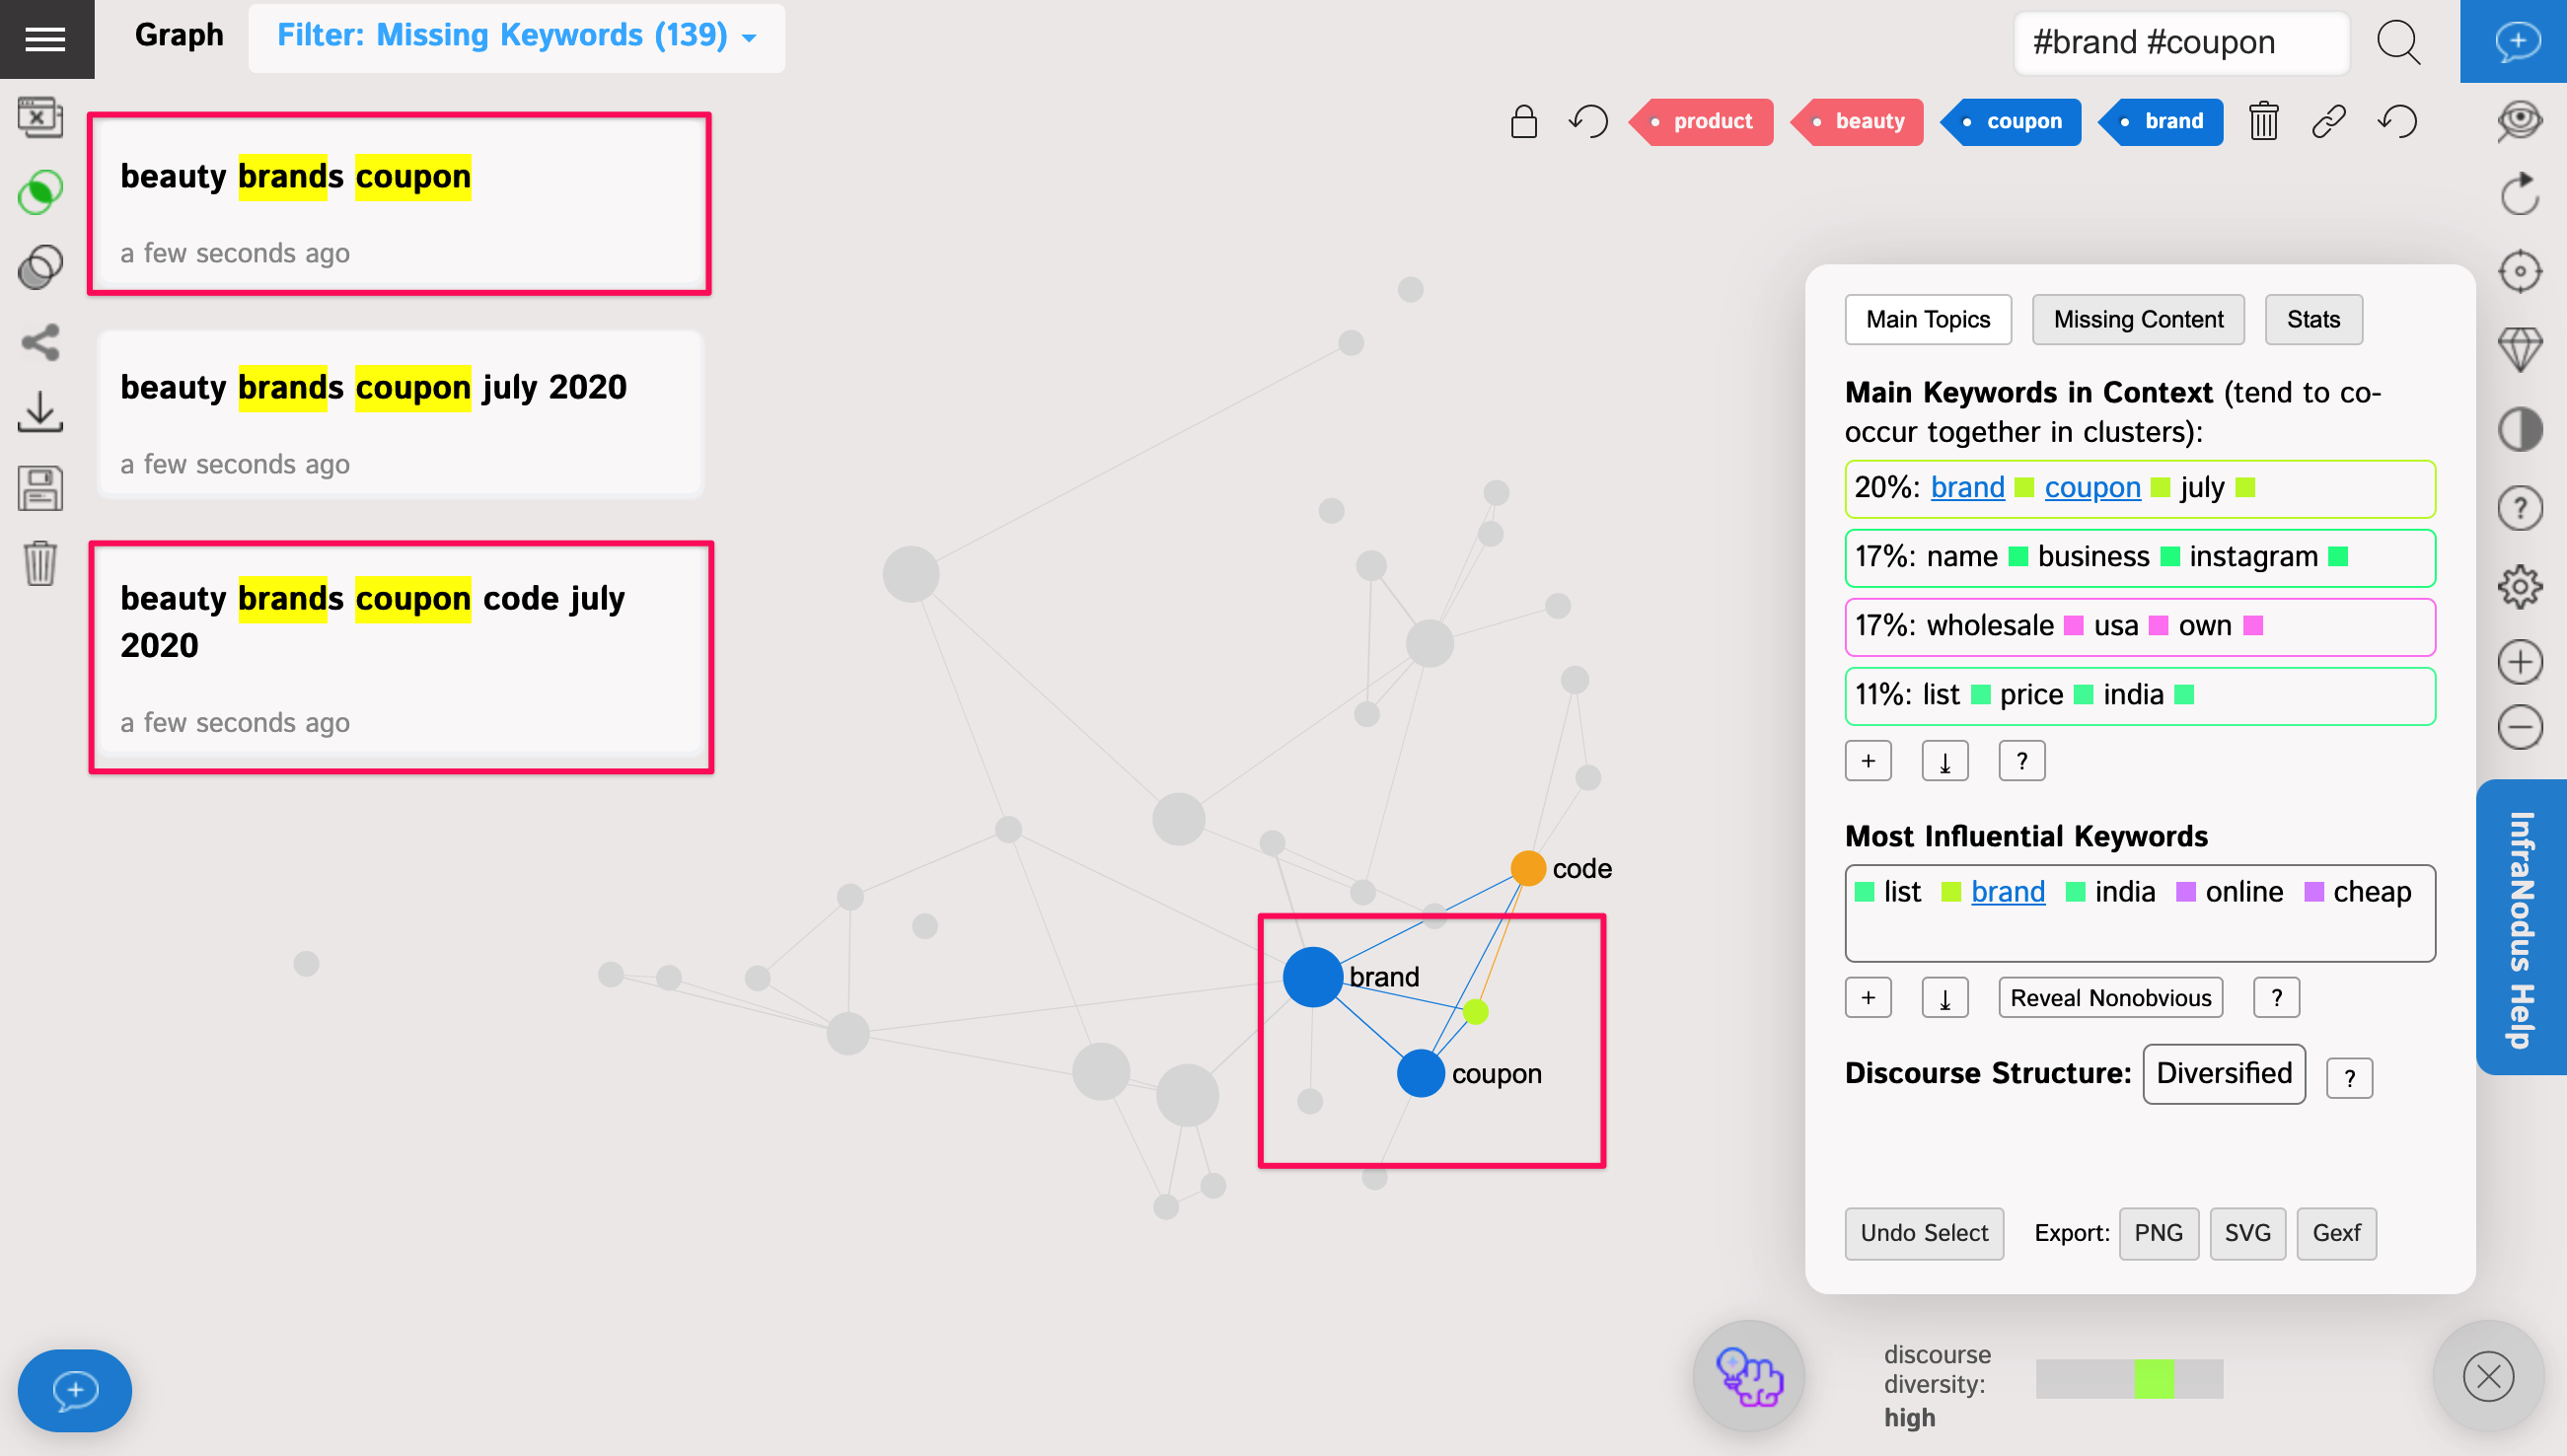
For instance, in this case, we see the exact keyword phrases that are used together with "brand" "coupons".
Step 7: Generate Keyword Ideas
The fourth graph is your keywords ideas, which you can select from the graph or the analytics panel or simply by adding them into the + ideas Editor panel. Choose the keywords you find interesting and add them to this graph:
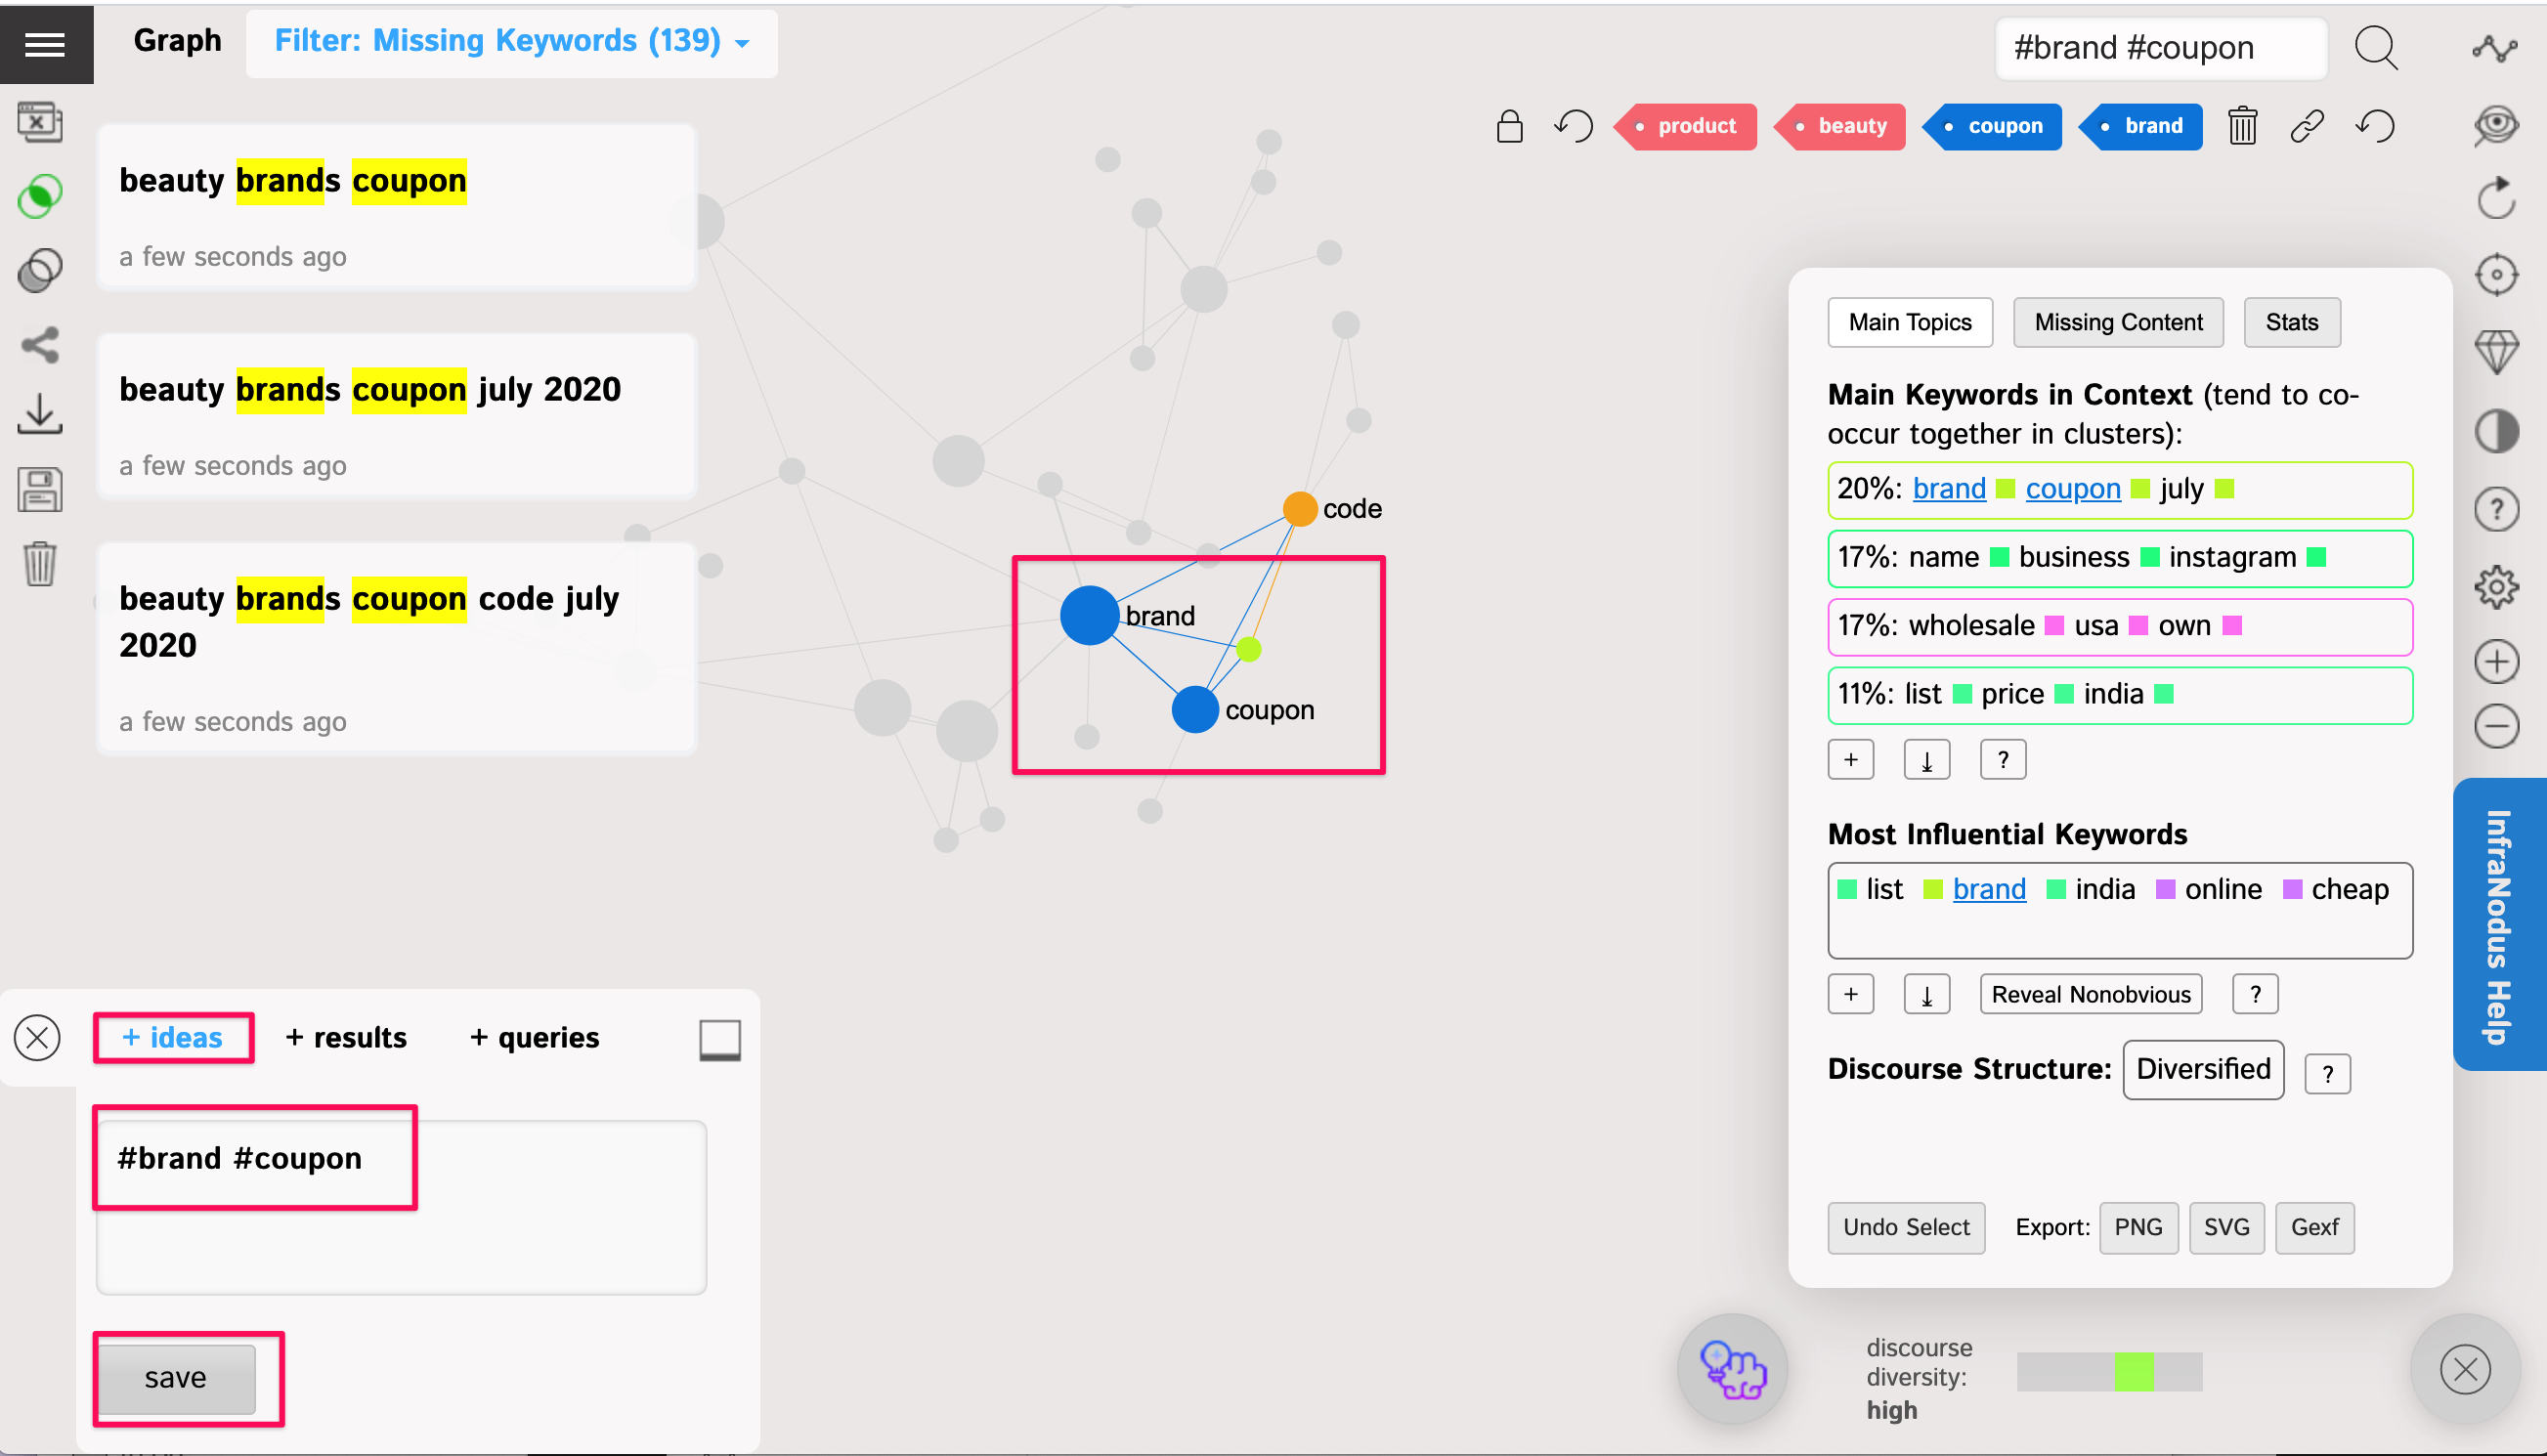
You can click on whatever you find relevant and it will be automatically added to the + Ideas panel on the left. You can then save those keywords for future reference.
Step 8. Insight Generation You can also access additional insights in the Analytics > Missing Content tab. Click the Missing Content tab to reveal the missing nodes and structural gaps in content: things that could be related but are not yet — this is also potentially interesting content ideas.
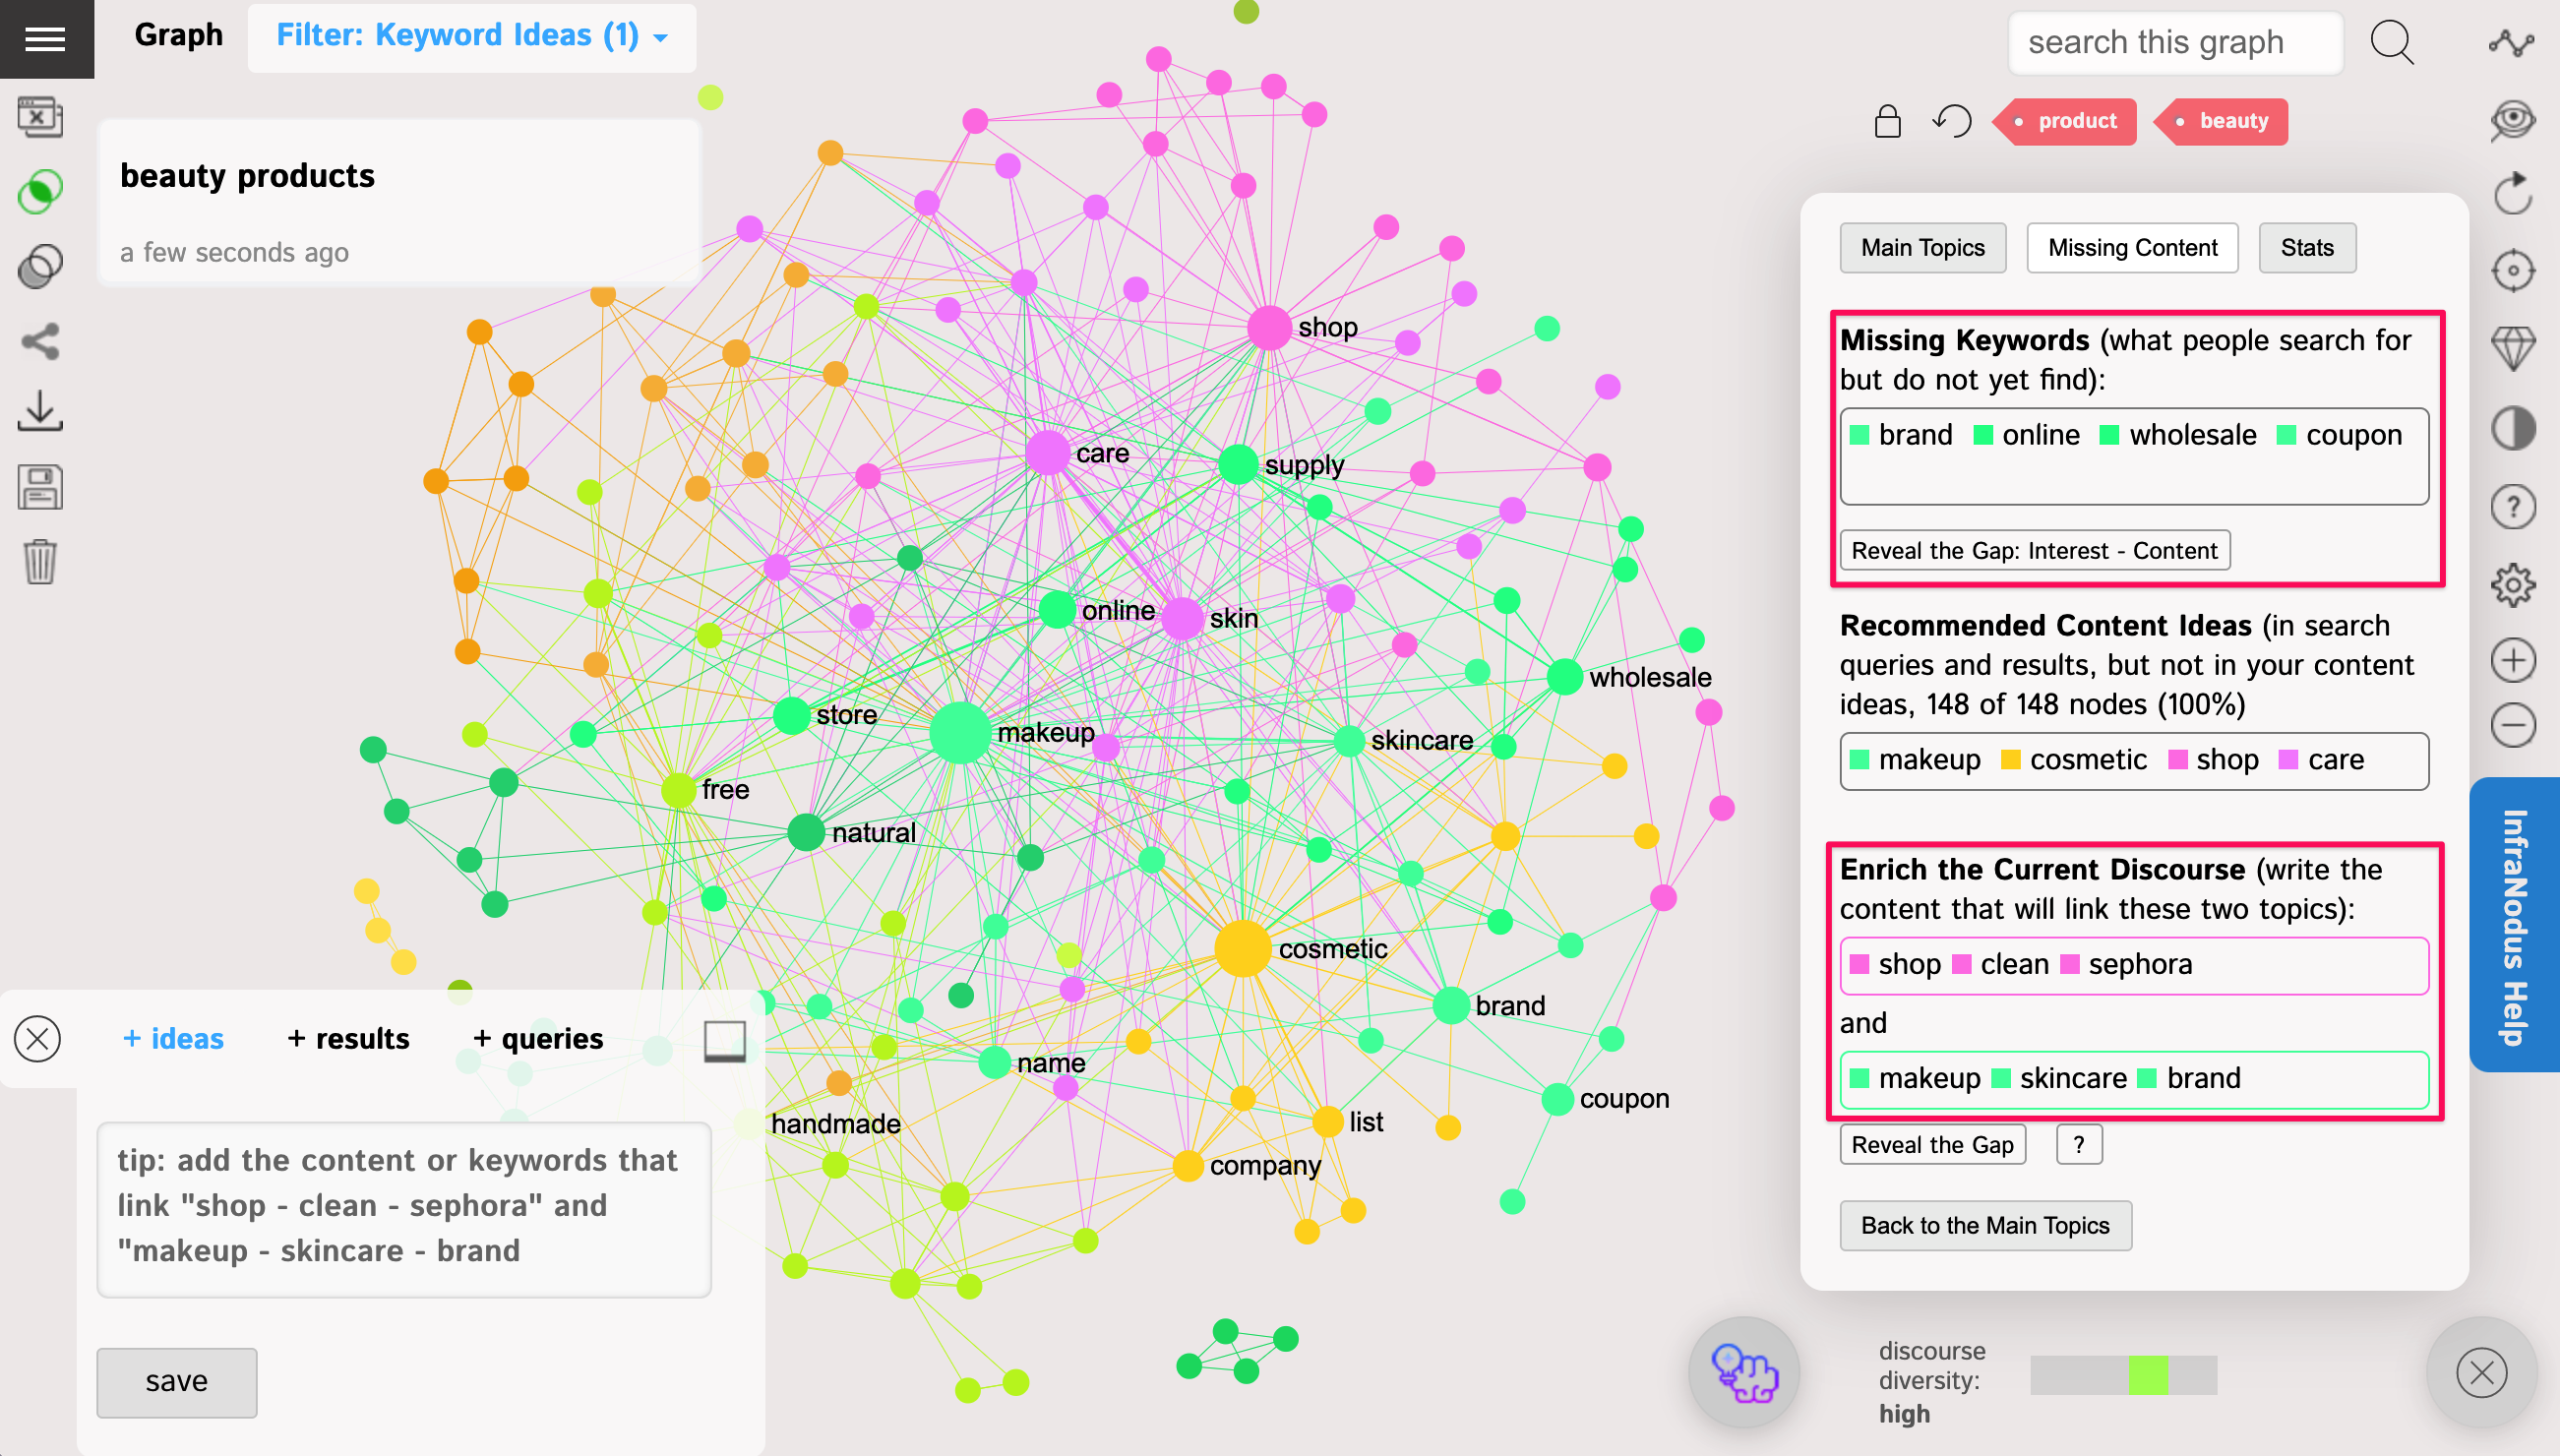
As you can see, the structural gap is between "shop", "clean", "sephora" and "makeup", "skincare", "brand" — creating the content between these two topics will generate something that does not exist yet.
Step 9. Click on the Stats to reveal the full list of words and also the most popular keyword phrases (bigrams). You can export them as a CSV file for further analysis.
Step 10. You can expand your search and add either Google search results for a certain query (click +results tab at the bottom left) or more keyword suggestions (click +queries)
Comments
0 comments
Please sign in to leave a comment.